
Berylls by AlixPartners TOP 100 supplier study 2025
Berylls by AlixPartners TOP 100 supplier study 2025 Munich, August 2025 Y ou hear it everywhere in the corridors of
WANT TO DISCOVER MORE?

Insights On Air | Berylls Podcast
Sustainability is no longer just a cost factor – it’s becoming a core business driver. In this episode, we explore how automotive companies can turn green initiatives into profitable strategies, from supply chain resilience to new mobility models.
Berylls by AlixPartners

That’s right – we’re talking about overcapacity, import tariffs, job cuts, and business model diversification.
The number of people employed in Germany’s automotive supplier industry is declining sharply. According to current figures, the industry employs 267,000 people, i.e., 14% fewer than in 2019. The employment figures in the supplier industry thus vividly illustrate the situation facing Germany as an automotive nation. Whereas 4.9 million vehicles were still made in Germany in 2019, the figure had fallen to just 4.2 million by 2024 – a downturn of 14% – and there’s no sign of a turnaround in the foreseeable future.
Automotive Consulting: Who we are
Together we are even more powerful - Berylls Strategy Advisors and Berylls Mad Media are merging to form Berylls by AlixPartners, under the highly renowned and international umbrella of AlixPartners. Berylls' outstanding expertise as a strategy, sales and digital consultancy combines with AlixPartners' consultancy offering in the areas of restructuring, transformation and performance improvement services to create a perfect match.
As Berylls by AlixPartners, we will continue our ambitious growth and, with the broader range of services, become an even stronger consulting team for the entire automotive and mobility industry.
The latest about Berylls by AlixPartners

The global management consultancy AlixPartners has acquired Berylls and thus the consulting business of Berylls Strategy Advisors and Berylls Mad Media. The deal was closed on 31.05.2024.
Following the successfull completion of the takeover, the services of the acquired management consulting units will be offered under the name “Berylls by AlixPartners” with immediate effect. The takeover involves around 160 Berylls employees, bringing AlixPartners’ workforce in the DACH region to around 400.
Our mission
Our mission is to create a sustainable as well as economically viable future for the global automobility industry by thinking automobility end-to-end.
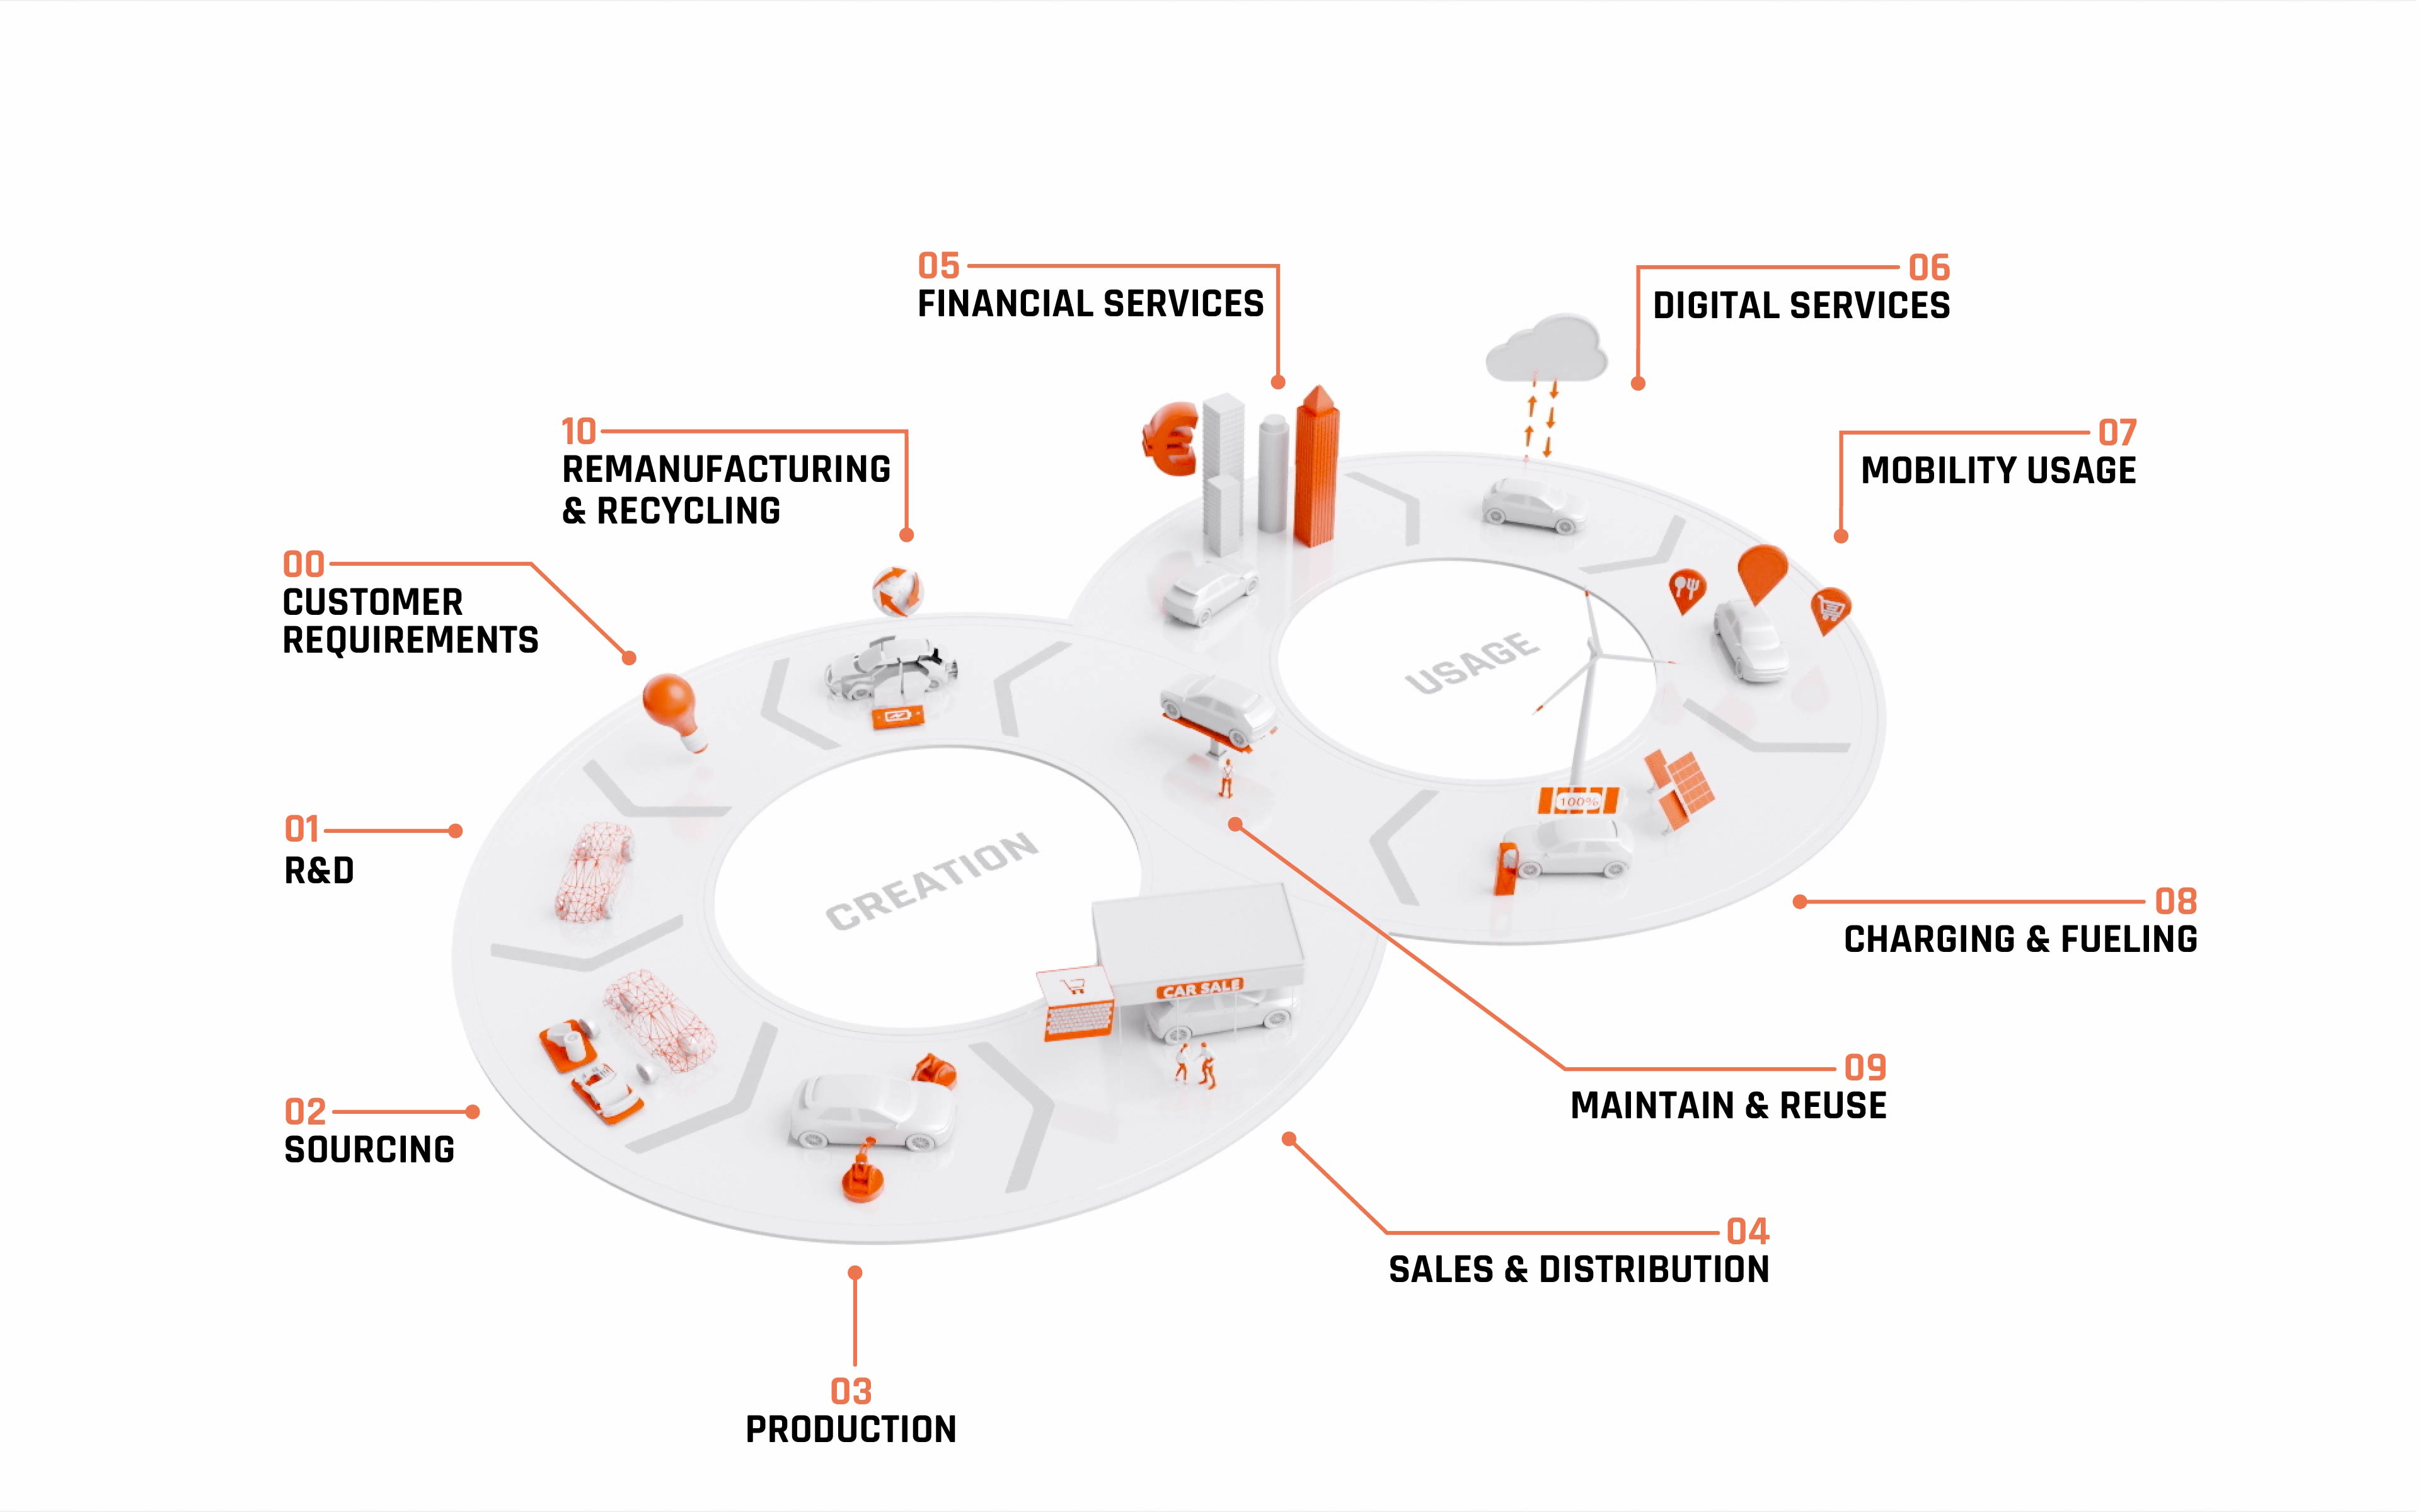
Our approach to accomplishing this we call the Berylls Loop. It covers the entire automotive value chain end-to-end and is at the heart of everything we do.
Our mission
Thinking Automobility End-To-End
Our mission is to create a sustainable as well as economically viable future for the global automobility industry by thinking automobility end-to-end.
Our approach to accomplishing this we call the Berylls Loop. It covers the entire automotive value chain end-to-end and is at the heart of everything we do.
00 Customer requirements
In everything we do we always start with the customer. We help clients identify their customers’ needs and translate them into actionable product requirements for physical and digital products.
SERVICES
Impact assessment of MoD on vehicle sales
Challenge
Solution
Result
Urban mobility market model
Challenge
Solution
Result
Brand and product portfolio repositioning to match new lifestyle segments
Challenge
Solution
Result
Berylls Use Case Enabler Matrix
Challenge
Solution
Result
01 R&D
We help clients translate product ideas into platforms, modules, components, and service offerings and define product portfolios that integrate physical goods and digital services.
SERVICES
Sustainability, Portfolio strategy, Software & architecture, Transformation, New business, E-Mobility, Autonomous driving, Mobility services
Leadership team development in the context of autonomous driving
Challenge
Solution
Result
Designing a “future-proof” product line organization
Challenge
Solution
Result
Tier 1 business model transformation from combustion engine to e-mobility
Challenge
Solution
Result
Task force for the development of an HV onboard charger
Challenge
Solution
Result
Shared autonomy strategy and implementation planning
Challenge
Solution
Result
AD tech provider PMI
Challenge
Solution
Result
Scenario-based Tier 1 portfolio strategy assessment
Challenge
Solution
Result
E-Mobility Academy:
upskilling for e-mobility across all competence levels
Challenge
Solution
Result
02 Sourcing
We help clients build powerful value networks and support them in making sourcing decisions, qualifying their suppliers and in developing new sourcing and delivery models for new software-enabled applications.
SERVICES
Operations, Software & architecture, M&A and transactions, Transformation
Ensuring the fit of OEM and supplier organizations for the “cell of tomorrow”
Challenge
Solution
Result
Strategic directions for resilient supply chains
Challenge
Solution
Result
Procurement division organizational redesign
Challenge
Solution
Result
A123 48V battery task force
Challenge
Solution
Result
Task force to launch premium SUV in the US
Challenge
Solution
Result
Wire harness second supplier qualification
Challenge
Solution
Result
Seat cover back-up supplier qualification
Challenge
Solution
Result
Pricing assessment and plant enablement program
Challenge
Solution
Result
Global quality improvement program
Challenge
Solution
Result
03 Production
We help clients launch new product lines, technologies and applications as well as resolve bottlenecks, quality problems and production delays through task force engagements in high-stakes situations.
SERVICES
CASE STUDIES
Target picture development for production plant of a premium OEM
Challenge
Solution
Result
Strategy and organization development for the industrialization function of a premium OEM
Challenge
Solution
Result
Site selection Europe
Challenge
Solution
Result
Launch and ramp-up support of infrastructure for innovative body shop for electric vehicles
Challenge
Solution
Result
Launch and ramp-up support of infrastructure for innovative body shop for electric vehicles
Challenge
Solution
Result
Developing a back-up solution for a wire harness supplier
Challenge
Solution
Result
Magna CCMi launch and site excellence team
Challenge
Solution
Result
Magna Kamtek restructuring and site excellence
Challenge
Solution
Result
Magna battery tray greenfield launch support
Challenge
Solution
Result
Synchronized production in make-to-order production for a body tool shop
Challenge
Solution
Result
Launch and ramp-up support for two innovative lightweight electric vehicles
Challenge
Solution
Result
04 Sales & Distribution
We help clients shape their go-to-market approaches, future-proof their sales organisations and develop innovative digital experiences as well as digital tools and processes that enable new omnichannel customer journeys.
SERVICES
CASE STUDIES
Implementation of a seamless cross-channel customer journey
Challenge
Solution
Result
Physical retail transformation for a premium OEM
Challenge
Solution
Result
Digital sales & marketing transformation for a German OEM at HQ and European level
Challenge
Solution
Result
Sales & marketing transformation program implementation for a German premium OEM
Challenge
Solution
Result
Sales & marketing target operating model development
Challenge
Solution
Result
Marketing planning and reverse funnel intelligence
Challenge
Solution
Result
CX execution framework for direct sales
Challenge
Solution
Result
Future target-oriented marketing processes and architecture
Challenge
Solution
Result
Sales & marketing funnel KPI & BI
Challenge
Solution
Result
Program management automotive e-commerce
Challenge
Solution
Result
Community-based customer interaction
Challenge
Solution
Result
Go-to-market strategy for BEVs for a volume brand in Europe
Challenge
Solution
Result
Regionalization of a sales & marketing organization of a large premium brand
Challenge
Solution
Result
Global marketing target operating model for a large premium car brand
Challenge
Solution
Result
Portfolio strategy for OEM top-end sub-brands
Challenge
Solution
Result
05 Financial Services
We support financial services, fleet and mobility companies – both captive and non-captive – to design and execute innovative financing and insurance, ownership and revenues models to maximize vehicle lifetime value.
SERVICES
CASE STUDIES
Carsharing strategy and implementation
Challenge
Solution
Result
Financial service strategy development
Challenge
Solution
Result
VaaS strategy
Challenge
Solution
Result
H2 car-sharing concept and implementation
Challenge
Solution
Result
Car-sharing strategy
Challenge
Solution
Result
Car-sharing and subscription CDD
Challenge
Solution
Result
Developing the global 2030 strategy for a leading global OEM captive
Challenge
Solution
Result
Product and service innovation strategy for a German OEM captive leasing unit
Challenge
Solution
Result
Multi-cycle sales model to maximize Vehicle Lifetime Value (VLV)
Challenge
Solution
Result
06 Digital Services
We help clients transition from the hardware of today to the software-defined products of tomorrow by scaling digital products and experiences that connect seamlessly to the physical world.
SERVICES
Software & architecture, Transformation, Connectivity, Data
CASE STUDIES
Mobile app strategy
Challenge
Solution
Result
Metaverse
Challenge
Solution
Result
IT location strategy
Challenge
Solution
Result
Selective digitalization of the customer experience of a top-end luxury car brand
Challenge
Solution
Result
Software market size modelling
Challenge
Solution
Result
Strategy update and implementation
Challenge
Solution
Result
Reorganization of the digital value chain
Challenge
Solution
Result
SW product strategy
Challenge
Solution
Result
Commercial due diligence SW-testing tool company
Challenge
Solution
Result
07 Mobility Usage
We support and bootstrap new mobility businesses and start-ups from target picture development and operational design through pricing concepts and supplier selection to fully operational minimum viable products and market introduction.
SERVICES
Portfolio strategy, Software & architecture, Mobility services, Connectivity
CASE STUDIES
AD go-to-market strategy
Challenge
Solution
Result
Pooling service operator company building
Challenge
Solution
Result
Business building and scaling support
Challenge
Solution
Result
Mobility strategy development and mobility unit carve-out
Challenge
Solution
Result
Mobility target picture
Challenge
Solution
Result
Mobility strategy review
Challenge
Solution
Result
Mobility services portfolio review
Challenge
Solution
Result
Long-distance robo-taxi service development
Challenge
Solution
Result
Micro-mobility strategy and market model
Challenge
Solution
Result
Ride-hailing CDD
Challenge
Solution
Result
Autonomous ride-hailing go-to-market support
Challenge
Solution
Result
Modular architecture strategy for a mobility solutions provider
Challenge
Solution
Result
Identification of future mobility business opportunities and design of matching business models
Challenge
Solution
Result
08 Charging & Fueling
We help clients develop charging strategies, charging business models and charging customer journeys as well as digital charging solutions.
SERVICES
Sustainability, Software & architecture, Mobility services, Connectivity, Data
CASE STUDIES
Business model transition from “fueling” to “charging”
Challenge
Solution
Result
Customer journey “charging”
Challenge
Solution
Result
Charging strategy 2030
Challenge
Solution
Result
Charging strategy 2030
Challenge
Solution
Result
Identification of potential fields of value creation along the electric vehicle value chain
Challenge
Solution
Result
Investigation of business opportunities and potential business models in hydrogen mobility
Challenge
Solution
Result
Designing a charging customer journey through the entire customer life cycle
Challenge
Solution
Result
09 Maintain & Reuse
We help clients design service products, service operating models and service customer journeys as well as multi-cycle sales models and yield concepts including devising relevant governances and KPIs and developing intelligent matching and allocation algorithms.
SERVICES
Portfolio strategy, Future sales
CASE STUDIES
Physical retail transformation for a premium OEM
Challenge
Solution
Result
Business model evaluation of a sustainable spare parts company
Challenge
Solution
Result
Development of a used-car strategy for a large premium car retailer
Challenge
Solution
Result
Multi-cycle sales model to maximize Vehicle Lifetime Value (VLV)
Challenge
Solution
Result
10 Remanufacturing & Recycling
We help clients integrate circularity into product development process, devise reuse, remanufacturing and recycling strategies and develop second-life solutions for automotive batteries.
SERVICES
CASE STUDIES
Strategic options and target picture development in recycling
Challenge
Solution
Result
Business model evaluation of a sustainable spare parts company
Challenge
Solution
Result
Beim Laden der Videos ist ein Fehler aufgetreten.
Scroll Down to explore more


Scroll Up to go back
Scroll Down to explore more
Scroll Up to go back
Scroll Down to explore more
Scroll Up to go back
Scroll Down to explore more
Scroll Up to go back
Scroll Down to explore more
Scroll Up to go back
Scroll Down to explore more
Scroll Up to go back
Scroll Down to explore more
Scroll Up to go back
Scroll Down to explore more
Scroll Up to go back
Scroll Down to explore more
Scroll Up to go back
Scroll Down to explore more
Scroll Up to go back
Scroll Down to explore more
Scroll Up to go back
Scroll Down to explore more
Scroll Up to go back
Scroll Down to explore more
00 Customer requirements
In everything we do we always start with the customer. We help clients identify their customers’ needs and translate them into actionable product requirements for physical and digital products.
SERVICES
CASE STUDIES
Impact assessment of MoD on vehicle sales
Challenge
Solution
Result
Urban mobility market model
Challenge
Solution
Result
Brand and product portfolio repositioning to match new lifestyle segments
Challenge
Solution
Result
Berylls Use Case Enabler Matrix
Challenge
Solution
Result
01 R&D
We help clients translate product ideas into platforms, modules, components, and service offerings and define product portfolios that integrate physical goods and digital services.
SERVICES
Sustainability, Portfolio strategy, Software & architecture, Transformation, New business, E-Mobility, Autonomous driving, Mobility services
CASE STUDIES
Leadership team development in the context of autonomous driving
Challenge
Solution
Result
Designing a “future-proof” product line organization
Challenge
Solution
Result
Tier 1 business model transformation from combustion engine to e-mobility
Challenge
Solution
Result
Task force for the development of an HV onboard charger
Challenge
Solution
Result
Shared autonomy strategy and implementation planning
Challenge
Solution
Result
AD tech provider PMI
Challenge
Solution
Result
Scenario-based Tier 1 portfolio strategy assessment
Challenge
Solution
Result
E-Mobility Academy:
upskilling for e-mobility across all competence levels
Challenge
Solution
Result
02 Sourcing
We help clients build powerful value networks and support them in making sourcing decisions, qualifying their suppliers and in developing new sourcing and delivery models for new software-enabled applications.
SERVICES
Operations, Software & architecture, M&A and transactions, Transformation
CASE STUDIES
Ensuring the fit of OEM and supplier organizations for the “cell of tomorrow”
Challenge
Solution
Result
Strategic directions for resilient supply chains
Challenge
Solution
Result
Procurement division organizational redesign
Challenge
Solution
Result
A123 48V battery task force
Challenge
Solution
Result
Task force to launch premium SUV in the US
Challenge
Solution
Result
Wire harness second supplier qualification
Challenge
Solution
Result
Seat cover back-up supplier qualification
Challenge
Solution
Result
Pricing assessment and plant enablement program
Challenge
Solution
Result
Global quality improvement program
Challenge
Solution
Result
03 Production
We help clients launch new product lines, technologies and applications as well as resolve bottlenecks, quality problems and production delays through task force engagements in high-stakes situations.
SERVICES
CASE STUDIES
Target picture development for production plant of a premium OEM
Challenge
Solution
Result
Strategy and organization development for the industrialization function of a premium OEM
Challenge
Solution
Result
Site selection Europe
Challenge
Solution
Result
Launch and ramp-up support of infrastructure for innovative body shop for electric vehicles
Challenge
Solution
Result
Launch and ramp-up support of infrastructure for innovative body shop for electric vehicles
Challenge
Solution
Result
Developing a back-up solution for a wire harness supplier
Challenge
Solution
Result
Magna CCMi launch and site excellence team
Challenge
Solution
Result
Magna Kamtek restructuring and site excellence
Challenge
Solution
Result
Magna battery tray greenfield launch support
Challenge
Solution
Result
Synchronized production in make-to-order production for a body tool shop
Challenge
Solution
Result
Launch and ramp-up support for two innovative lightweight electric vehicles
Challenge
Solution
Result
04 Sales & Distribution
We help clients shape their go-to-market approaches, future-proof their sales organisations and develop innovative digital experiences as well as digital tools and processes that enable new omnichannel customer journeys.
SERVICES
CASE STUDIES
Implementation of a seamless cross-channel customer journey
Challenge
Solution
Result
Physical retail transformation for a premium OEM
Challenge
Solution
Result
Digital sales & marketing transformation for a German OEM at HQ and European level
Challenge
Solution
Result
Sales & marketing transformation program implementation for a German premium OEM
Challenge
Solution
Result
Sales & marketing target operating model development
Challenge
Solution
Result
Marketing planning and reverse funnel intelligence
Challenge
Solution
Result
CX execution framework for direct sales
Challenge
Solution
Result
Future target-oriented marketing processes and architecture
Challenge
Solution
Result
Sales & marketing funnel KPI & BI
Challenge
Solution
Result
Program management automotive e-commerce
Challenge
Solution
Result
Community-based customer interaction
Challenge
Solution
Result
Go-to-market strategy for BEVs for a volume brand in Europe
Challenge
Solution
Result
Regionalization of a sales & marketing organization of a large premium brand
Challenge
Solution
Result
Global marketing target operating model for a large premium car brand
Challenge
Solution
Result
Portfolio strategy for OEM top-end sub-brands
Challenge
Solution
Result
05 Financial Services
We support financial services, fleet and mobility companies – both captive and non-captive – to design and execute innovative financing and insurance, ownership and revenues models to maximize vehicle lifetime value.
SERVICES
CASE STUDIES
Carsharing strategy and implementation
Challenge
Solution
Result
Financial service strategy development
Challenge
Solution
Result
VaaS strategy
Challenge
Solution
Result
H2 car-sharing concept and implementation
Challenge
Solution
Result
Car-sharing strategy
Challenge
Solution
Result
Car-sharing and subscription CDD
Challenge
Solution
Result
Developing the global 2030 strategy for a leading global OEM captive
Challenge
Solution
Result
Product and service innovation strategy for a German OEM captive leasing unit
Challenge
Solution
Result
Multi-cycle sales model to maximize Vehicle Lifetime Value (VLV)
Challenge
Solution
Result
06 Digital Services
We help clients transition from the hardware of today to the software-defined products of tomorrow by scaling digital products and experiences that connect seamlessly to the physical world.
SERVICES
Software & architecture, Transformation, Connectivity, Data
CASE STUDIES
Mobile app strategy
Challenge
Solution
Result
Metaverse
Challenge
Solution
Result
IT location strategy
Challenge
Solution
Result
Selective digitalization of the customer experience of a top-end luxury car brand
Challenge
Solution
Result
Software market size modelling
Challenge
Solution
Result
Strategy update and implementation
Challenge
Solution
Result
Reorganization of the digital value chain
Challenge
Solution
Result
SW product strategy
Challenge
Solution
Result
Commercial due diligence SW-testing tool company
Challenge
Solution
Result
07 Mobility Usage
We support and bootstrap new mobility businesses and start-ups from target picture development and operational design through pricing concepts and supplier selection to fully operational minimum viable products and market introduction.
SERVICES
Portfolio strategy, Software & architecture, Mobility services, Connectivity
CASE STUDIES
AD go-to-market strategy
Challenge
Solution
Result
Pooling service operator company building
Challenge
Solution
Result
Business building and scaling support
Challenge
Solution
Result
Mobility strategy development and mobility unit carve-out
Challenge
Solution
Result
Mobility target picture
Challenge
Solution
Result
Mobility strategy review
Challenge
Solution
Result
Mobility services portfolio review
Challenge
Solution
Result
Long-distance robo-taxi service development
Challenge
Solution
Result
Micro-mobility strategy and market model
Challenge
Solution
Result
Ride-hailing CDD
Challenge
Solution
Result
Autonomous ride-hailing go-to-market support
Challenge
Solution
Result
Modular architecture strategy for a mobility solutions provider
Challenge
Solution
Result
Identification of future mobility business opportunities and design of matching business models
Challenge
Solution
Result
08 Charging & Fueling
We help clients develop charging strategies, charging business models and charging customer journeys as well as digital charging solutions.
SERVICES
Sustainability, Software & architecture, Mobility services, Connectivity, Data
CASE STUDIES
Business model transition from “fueling” to “charging”
Challenge
Solution
Result
Customer journey “charging”
Challenge
Solution
Result
Charging strategy 2030
Challenge
Solution
Result
Charging strategy 2030
Challenge
Solution
Result
Identification of potential fields of value creation along the electric vehicle value chain
Challenge
Solution
Result
Investigation of business opportunities and potential business models in hydrogen mobility
Challenge
Solution
Result
Designing a charging customer journey through the entire customer life cycle
Challenge
Solution
Result
09 Maintain & Reuse
We help clients design service products, service operating models and service customer journeys as well as multi-cycle sales models and yield concepts including devising relevant governances and KPIs and developing intelligent matching and allocation algorithms.
SERVICES
Portfolio strategy, Future sales
CASE STUDIES
Physical retail transformation for a premium OEM
Challenge
Solution
Result
Business model evaluation of a sustainable spare parts company
Challenge
Solution
Result
Development of a used-car strategy for a large premium car retailer
Challenge
Solution
Result
Multi-cycle sales model to maximize Vehicle Lifetime Value (VLV)
Challenge
Solution
Result
10 Remanufacturing & Recycling
We help clients integrate circularity into product development process, devise reuse, remanufacturing and recycling strategies and develop second-life solutions for automotive batteries.
SERVICES
CASE STUDIES
Strategic options and target picture development in recycling
Challenge
Solution
Result
Business model evaluation of a sustainable spare parts company
Challenge
Solution
Result
Across 9 SERVICE LINES, and 5 VERTICALS we cover all aspects of the automobility value chain and have the capabilities to take things all the way to the finish line, including developing our own products.
Sustainability and e-mobility represent the cutting edge of automobility. A business model that does not integrate environmental and social measures with commercial targets cannot be economically viable. Berylls has a long track record in making sustainability work both for our clients and in our own business ventures, for example with WALL-E – the first free-to-the-user e-mobility infrastructure initiative.
To respond to the combined disruptive forces of digitalization, connectivity, shared and e-mobility solutions, automotive OEMs along with suppliers, start-ups and service companies are radically redrawing their product portfolios. This is nowhere more evident than in the car itself. Berylls has helped automotive companies combine new product attributes, software-defined features, new ownership models and digital services into internally consistent portfolios that integrate physical products and digital services.
To become a commercial reality, a portfolio must be translated into platforms, modules, components, manufacturing technologies and service offerings. Software is the glue that holds all these technologies together. Berylls helps clients define products for a radically different future as they transition from the hardware of today to the software-defined products of tomorrow.
No product will ever reach its target customers if it is not developed, industrialized and manufactured on time, on quality and on cost. Berylls has helped clients successfully launch new product lines, technologies and applications, developing new plants and assembly lines, and resolving bottlenecks, quality problems and production delays through task force engagements in high-stakes situations. We work from strategy to reality, and from the boardroom to the shopfloor.
Where automotive retail used to be about selling, financing and servicing cars through a network of dealerships, this landscape is increasingly being disrupted by new direct sales models, new digital service offerings and the emergence of third-party intermediaries. No OEM today can thrive without a potent digital offering that seamlessly integrates physical formats. And the more an OEM is positioned toward luxury, the more important physical retail networks become. We have helped OEMs build full-service offerings around their online and offline retail presence while at the same time increasing their revenue share across the vehicle’s entire lifetime.
Mergers, acquisitions and strategic partnerships can be powerful enablers in gaining new skills or competencies, or accessing new markets and customers, or simply building scale. They help companies remain competitive or transform their business in the face of coming change. With our extensive track record in conducting partner and target searches, due diligences and post-merger integration programs, Berylls has helped many clients build powerful value networks around strategic partnerships or through equity investments and takeovers.
Developing new software-driven competencies and business models goes to the heart of what defines a business. Successfully executing such a business transformation holds the key to securing a company’s future. Berylls has helped many clients build fast, agile and effective organizations that are synchronized to their strategy, that have the right mix of culture and skills, and that are equipped to bring the complexity that comes with automobility under control.
As few automotive companies can fund the massive investments needed for new products and new technologies from their operating cashflow alone, access to fresh capital is key. Some OEMs are restricted in their ability to raise capital through being undervalued. Others find financing but struggle to deliver their investors’ expectations. Addressing these problems requires an understanding of capital markets that goes beyond the fundamentals of revenue, profitability, and shareholder returns. This is why we at Berylls have developed our proprietary Automobility Index . The Index goes beyond the P&L fundamentals, evaluating company strategy, value networks and investor sentiment. Using our Index, Berylls helps clients to better understand investor expectations and develop investor stories that resonate with global capital markets.
As the pace of innovation accelerates new trends can emerge rapidly. Some trends like Big Data, connectivity and blockchain have already become mainstream. Others such as AI-powered chatbots or the metaverse are only just on the horizon. Whether mainstream or emerging, at Berylls we have a long track record of helping clients translate emerging trends into actual products. We translate trends into specific requirements and specifications that enable organizations to develop relevant products and bring them to market. And if needed we use our own resources to develop, fund and build products around the most powerful mega trends.
Some topics are so important they deserve special attention. Our 5 VERTICALS develop the most current expertise on the most critical topics in automobility.
No other technology appears as predictable and yet at the same time has so many unknowns as e-mobility. But while many questions remain unanswered the time for relying solely on legislators and governments is over.
Connected vehicles provide a unique customer experience, enhance B2B business opportunities, and improve products and internal processes. But most ecosystem-players have not fully realized opportunities to offer compelling services based around connected vehicles.
Technology breakthroughs and new businesses emerge continuously in the autonomous driving (AD) space. But all AD companies face immense pressure to make AD technology reliable and safe and to build profitable business models.
Mobility Services have experienced a rollercoaster ride over the past decade The coming one will show whether the transformation to a more convenient and efficient transit system will continue to stall or whether we will witness a necessary and overdue comeback story.
New data-driven business models have revolutionised the way customer insights are generated. But while the potential is immense, many automotive companies struggle to leverage date toward creating a competitive advantage.
Berylls Strategy Advisors is a top-management consulting firm focused exclusively on the automobility sector. We cover the entire automotive value chain from long-term strategic planning to operational performance improvements. Our clients value us as thought leaders in our industry and as entrepreneurial thinkers who don’t believe in one-size-fits-all solutions.
Our capabilities

Berylls Strategy Advisors is a top-management consulting firm focused exclusively on the automobility sector. We cover the entire automotive value chain from long-term strategic planning to operational performance improvements. Our clients value us as thought leaders in our industry and as entrepreneurial thinkers who don’t believe in one-size-fits-all solutions.

Sustainability and e-mobility represent the cutting edge of automobility. A business model that does not integrate environmental and social measures with commercial targets cannot be economically viable. Berylls has a long track record in making sustainability work both for our clients and in our own business ventures, for example with WALL-E – the first free-to-the-user e-mobility infrastructure initiative.
To respond to the combined disruptive forces of digitalization, connectivity, shared and e-mobility solutions, automotive OEMs along with suppliers, start-ups and service companies are radically redrawing their product portfolios. This is nowhere more evident than in the car itself. Berylls has helped automotive companies combine new product attributes, software-defined features, new ownership models and digital services into internally consistent portfolios that integrate physical products and digital services.
To become a commercial reality, a portfolio must be translated into platforms, modules, components, manufacturing technologies and service offerings. Software is the glue that holds all these technologies together. Berylls helps clients define products for a radically different future as they transition from the hardware of today to the software-defined products of tomorrow.
No product will ever reach its target customers if it is not developed, industrialized and manufactured on time, on quality and on cost. Berylls has helped clients successfully launch new product lines, technologies and applications, developing new plants and assembly lines, and resolving bottlenecks, quality problems and production delays through task force engagements in high-stakes situations. We work from strategy to reality, and from the boardroom to the shopfloor.
Where automotive retail used to be about selling, financing and servicing cars through a network of dealerships, this landscape is increasingly being disrupted by new direct sales models, new digital service offerings and the emergence of third-party intermediaries. No OEM today can thrive without a potent digital offering that seamlessly integrates physical formats. And the more an OEM is positioned toward luxury, the more important physical retail networks become. We have helped OEMs build full-service offerings around their online and offline retail presence while at the same time increasing their revenue share across the vehicle’s entire lifetime.
Mergers, acquisitions and strategic partnerships can be powerful enablers in gaining new skills or competencies, or accessing new markets and customers, or simply building scale. They help companies remain competitive or transform their business in the face of coming change. With our extensive track record in conducting partner and target searches, due diligences and post-merger integration programs, Berylls has helped many clients build powerful value networks around strategic partnerships or through equity investments and takeovers.
Developing new software-driven competencies and business models goes to the heart of what defines a business. Successfully executing such a business transformation holds the key to securing a company’s future. Berylls has helped many clients build fast, agile and effective organizations that are synchronized to their strategy, that have the right mix of culture and skills, and that are equipped to bring the complexity that comes with automobility under control.
As few automotive companies can fund the massive investments needed for new products and new technologies from their operating cashflow alone, access to fresh capital is key. Some OEMs are restricted in their ability to raise capital through being undervalued. Others find financing but struggle to deliver their investors’ expectations. Addressing these problems requires an understanding of capital markets that goes beyond the fundamentals of revenue, profitability, and shareholder returns. This is why we at Berylls have developed our proprietary Automobility Index . The Index goes beyond the P&L fundamentals, evaluating company strategy, value networks and investor sentiment. Using our Index, Berylls helps clients to better understand investor expectations and develop investor stories that resonate with global capital markets.
As the pace of innovation accelerates new trends can emerge rapidly. Some trends like Big Data, connectivity and blockchain have already become mainstream. Others such as AI-powered chatbots or the metaverse are only just on the horizon. Whether mainstream or emerging, at Berylls we have a long track record of helping clients translate emerging trends into actual products. We translate trends into specific requirements and specifications that enable organizations to develop relevant products and bring them to market. And if needed we use our own resources to develop, fund and build products around the most powerful mega trends.

Some topics are so important they deserve special attention. Our 5 VERTICALS develop the most current expertise on the most critical topics in automobility.
No other technology appears as predictable and yet at the same time has so many unknowns as e-mobility. But while many questions remain unanswered the time for relying solely on legislators and governments is over.
Connected vehicles provide a unique customer experience, enhance B2B business opportunities, and improve products and internal processes. But most ecosystem-players have not fully realized opportunities to offer compelling services based around connected vehicles.
Technology breakthroughs and new businesses emerge continuously in the autonomous driving (AD) space. But all AD companies face immense pressure to make AD technology reliable and safe and to build profitable business models.
Mobility Services have experienced a rollercoaster ride over the past decade The coming one will show whether the transformation to a more convenient and efficient transit system will continue to stall or whether we will witness a necessary and overdue comeback story.
New data-driven business models have revolutionised the way customer insights are generated. But while the potential is immense, many automotive companies struggle to leverage date toward creating a competitive advantage.
Join us
But Different: two simple words that have the potential to change everything – from the way we stand out to how we tackle challenges and opportunities. With But Different we break free of old routines and fixed habits.
The latest on our website
Berylls by AlixPartners TOP 100 supplier study 2025 Munich, August 2025 Y ou hear it everywhere in the corridors of
Editorial: The next setback for the supplier industry Munich, July 2025 A fter three years of recovery, the global supplier

Middle East BEV Consumer Study This Battery Electric Vehicle (BEV) Consumer Study offers comprehensive insights into consumer attitudes, preferences, and

Corporate management in times of uncertainty Munich, August 2024 H ow do we keep the company manageable as it becomes

Quo vadis, supplier industry – challenging times require bold action Munich, August 2024 I t is a well-known and widely

The art of mastering code – between budget overruns and future opportunities Munich, August 2024 N ew business models and