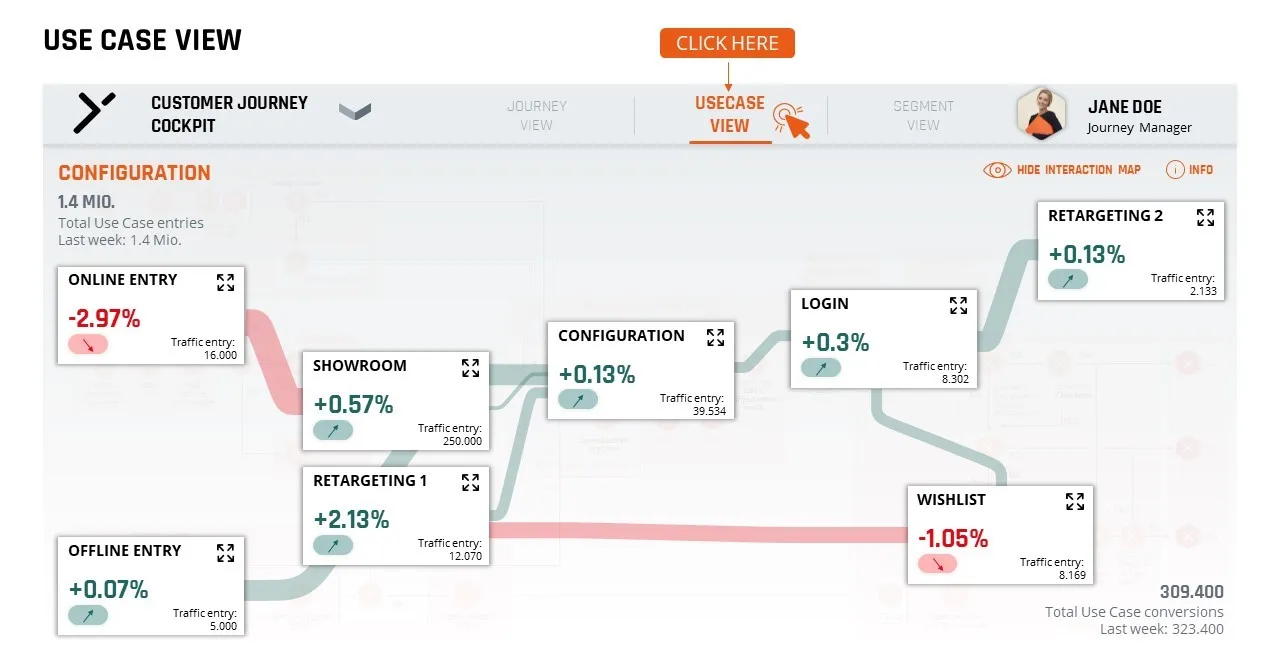
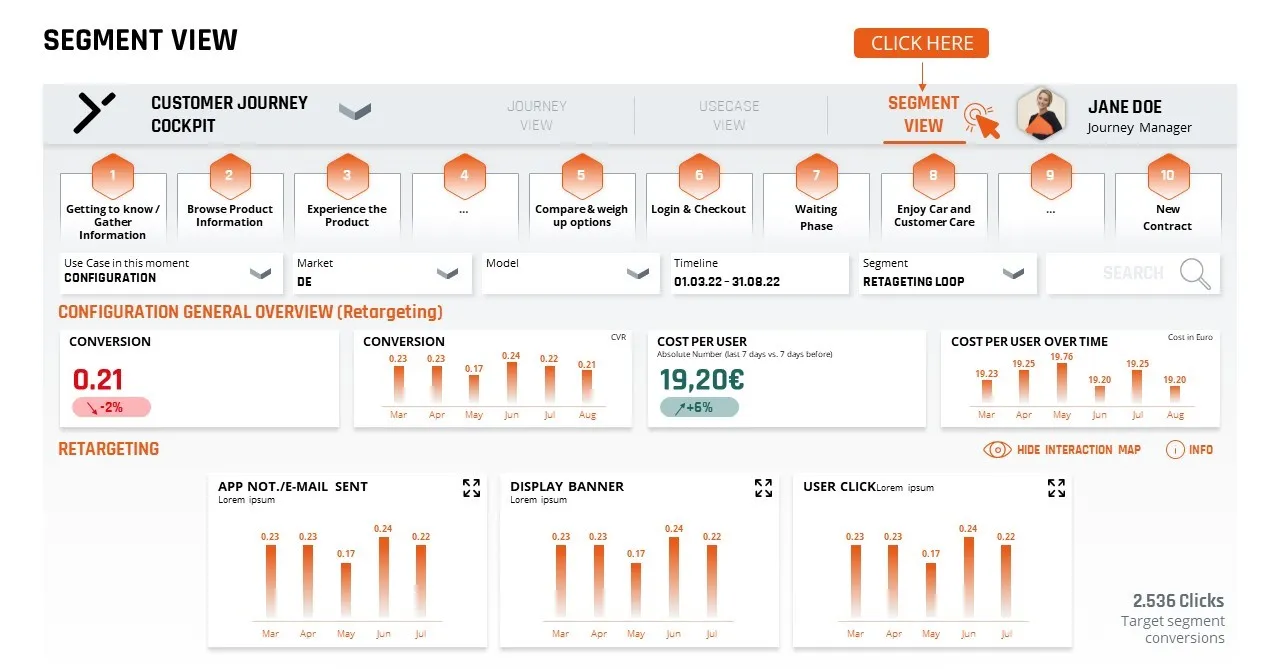
Finally, the Segment View (Figure 7 below) provides a more detailed visualization where one can use KPIs to identify the pain points precisely, and if necessary, conduct a more in-depth analysis to derive the action points and thus improve the customer experience.
In the highlighted example, one can see that the targeting is resonating with sufficient success to draw enough customers back to the site through the initial retargeting. The customer feels engaged. However, it is also clear that targeted customers are not continuing the journey, which may be because while the approach targets many customers, it raises expectations that are not met. Appropriate action points should now be derived, or another specific analysis should be conducted to form action points.
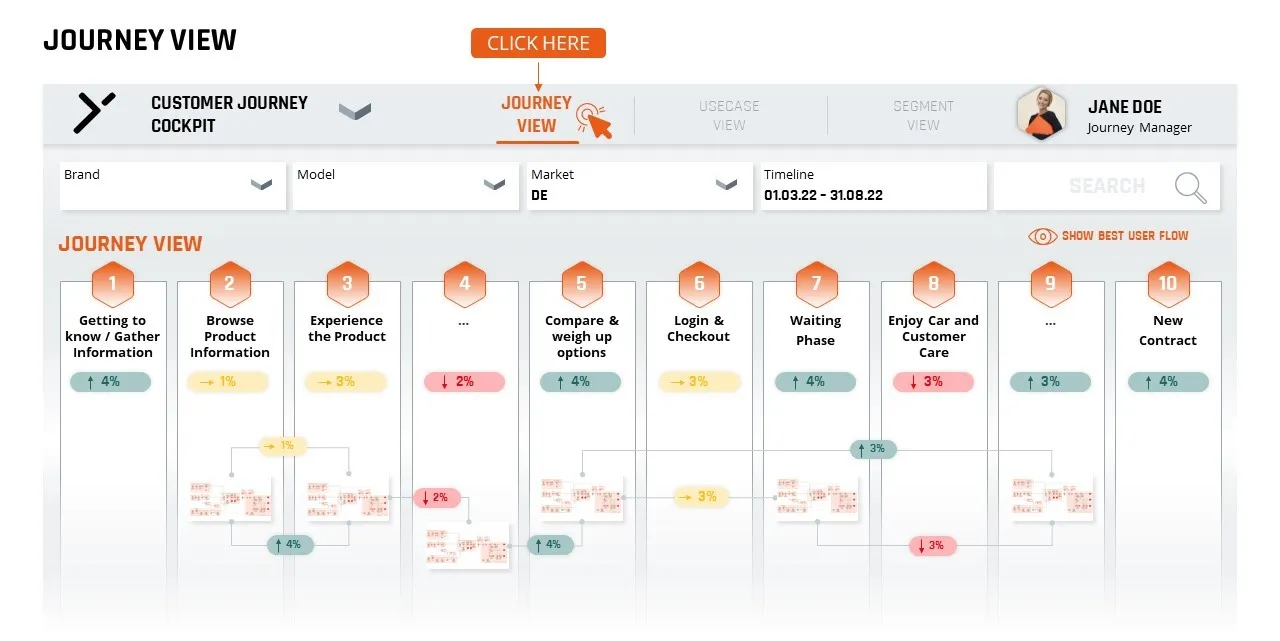
The advantage of our three-layer visualization approach is that one does not need to look at all processes in a complex environment. Instead, one can identify the pain points step by step by narrowing down the problem and working out the required action points. In addition, the visualization offers different representations for different stakeholders, depending on the required level of detail.
Based on the visualization, the optimization process can be triggered repeatedly like a loop, with the customer journey continually adapted and optimized in response to changing conditions.