WANT TO DISCOVER MORE?
he global automotive industry is still running at different product development and product introduction speeds. Chinese NEV leaders and software-defined-vehicle native players develop new models in less than 24 months while most established OEMs still need up to 50 months. OEMs therefore need to redesign their product development process (PDP).
And so do the suppliers and system integrators whose commercial viability depends on matching that cadence. The gap is not a vanity benchmark. For OEMs it translates into stranded R&D capital, technology obsolescence at launch, and lost market windows. For suppliers it translates into shorter program pipelines, margin pressure from OEMs rationalizing their supply base, and displacement by platform-capable Tier 0.5 players. Our Berylls by AlixPartners levers close these gaps holistically and systematically across the full value chain.
pen-Source middleware in automotive has moved past the proof-of-concept stage. The Eclipse Foundation's S-CORE project turns Original Equipment Manufacturer (OEM) adoption from a hypothetical into a concrete decision within the next 24–36 months. This paper evaluates the strategic case for participation from the perspective of R&D leaders, across three OEM and three supplier archetypes.
Open-source middleware should not be considered a universal-, but rather a strategic control lever. Its primary value is not free software, but reduced dependency, accelerated standardization, and reallocation of engineering effort away from non-differentiating layers.
Across the four hypotheses, the verdict is differentiated, not uniform. On lifecycle effort, the open-source path delivers up to ~20–40% lower one-time costs for contributing OEMs through shared joint development across a minimum of five contributing parties (OEMs and contributing suppliers) and the strong reduction of per-vehicle license fees. Even higher savings can apply if an existing solution without development contribution can be used.
On time savings, Software OEMs with high in-house software competences see roughly neutral outcomes (in-house baselines already short). Legacy OEMs in SDV Transformation and Technology Laggers save ~10–20% (three to ten months time) however, the latter need suppliers to be able to realize this advantage due to poor internal software skills. On product-lifecycle stability, the open-source solution matches proprietary middleware once the safety case is built and sufficient testing has been carried out (multiple applications from OEMs). On lifecycle risk, exposures shift from project-specific technical debt to shared governance dependence, leaving total risk no higher than proprietary development.
Winners of this transition are Legacy OEMs that shape the standard early as well as Traditional System/ Middleware suppliers that reposition from license vendors to integration and adaptation partners. Technology Laggers are offered the chance to catch up to advanced competitors at lower cost by utilizing such suppliers. Scaling of SoC Suppliers and Hyperscalers is further strengthened from their current position. Artificial intelligence (AI) bears on this shift both as a tool that accelerates middleware development and adaptation and as a workload the middleware must carry increasingly. The quantitative model here holds AI tooling constant and leaves those effects out of scope.
he automotive industry is entering a new era of product launches. While established OEMs still measure development and launch cycles in years, new competitors are redefining expectations around speed, agility, and execution.
At the same time, growing software complexity, rising customer expectations, and increasingly interconnected supply chains are placing unprecedented pressure on launch organizations. As a result, traditional launch management approaches are no longer sufficient.
Future Launch Management requires a fundamentally different mindset. Success depends not only on mastering software-defined vehicles and digital technologies, but also on solving the enduring challenges of industrialization, manufacturing readiness, supplier performance, and ramp-up stability. Companies must orchestrate digital and physical development worlds in parallel, leverage data more effectively, and build organizations capable of delivering faster, more reliable launches.
In this article, we explore eight key focus areas that will shape the future of automotive launch management and discuss how OEMs can transform vehicle launches from a source of risk into a sustainable competitive advantage in speed, quality, and execution excellence.
ow Europe’s electric truck-makers can avoid the mistakes of the car industry
The market share of battery electric trucks is relatively low but growing fast: this is the critical stage when the strategic choices made by European OEMs will determine their future.
1. Make truck BEVs the strategic core of the business. The electric vehicle can not be treated as an extension of the internal combustion engine business if companies are to respond to the structural nature of global competition with focus, capital discipline and industrial commitment.
2. Develop truck BEVs around defined European use cases. Companies should prioritize operational fit and total cost of ownership over technical overengineering or specification-driven positioning.
3. Industrialize locally and secure supply chain depth in Europe. This strategy can ensure tariff resilience, political legitimacy, delivery reliability and long-term strategic market embedding.
4. Radically shorten time-to-market and scale production early. Speed and volume – not legacy strength – will determine cost competitiveness and structural market position.
5. Prioritize early market penetration over short-term margin optimization. Scale effects and steep learning curves define long-term profitability in electrification.
6. Establish aftersales excellence and guaranteed uptime. These are core competitive differentiators, proving reliability, service depth and residual value performance under real European fleet conditions.
7. Treat battery electric trucks as an integrated ecosystem. Combine vehicle, charging, energy, digital operations and data governance into one coherent offering, actively shaping partnerships across logistics, infrastructure and software.
Europe’s passenger car makers have now made rapid strides in electric mobility, but not without some serious strategic errors along the way.
Manufacturers were slow to offer a compelling range of battery electric vehicles (BEVs), with high priced and poorly executed cars limiting the early adoption market. They struggled to get to grips with the software-led nature of BEV development. And above all they failed to convince buyers that an electric vehicle ecosystem including adequate charging infrastructure was in place.
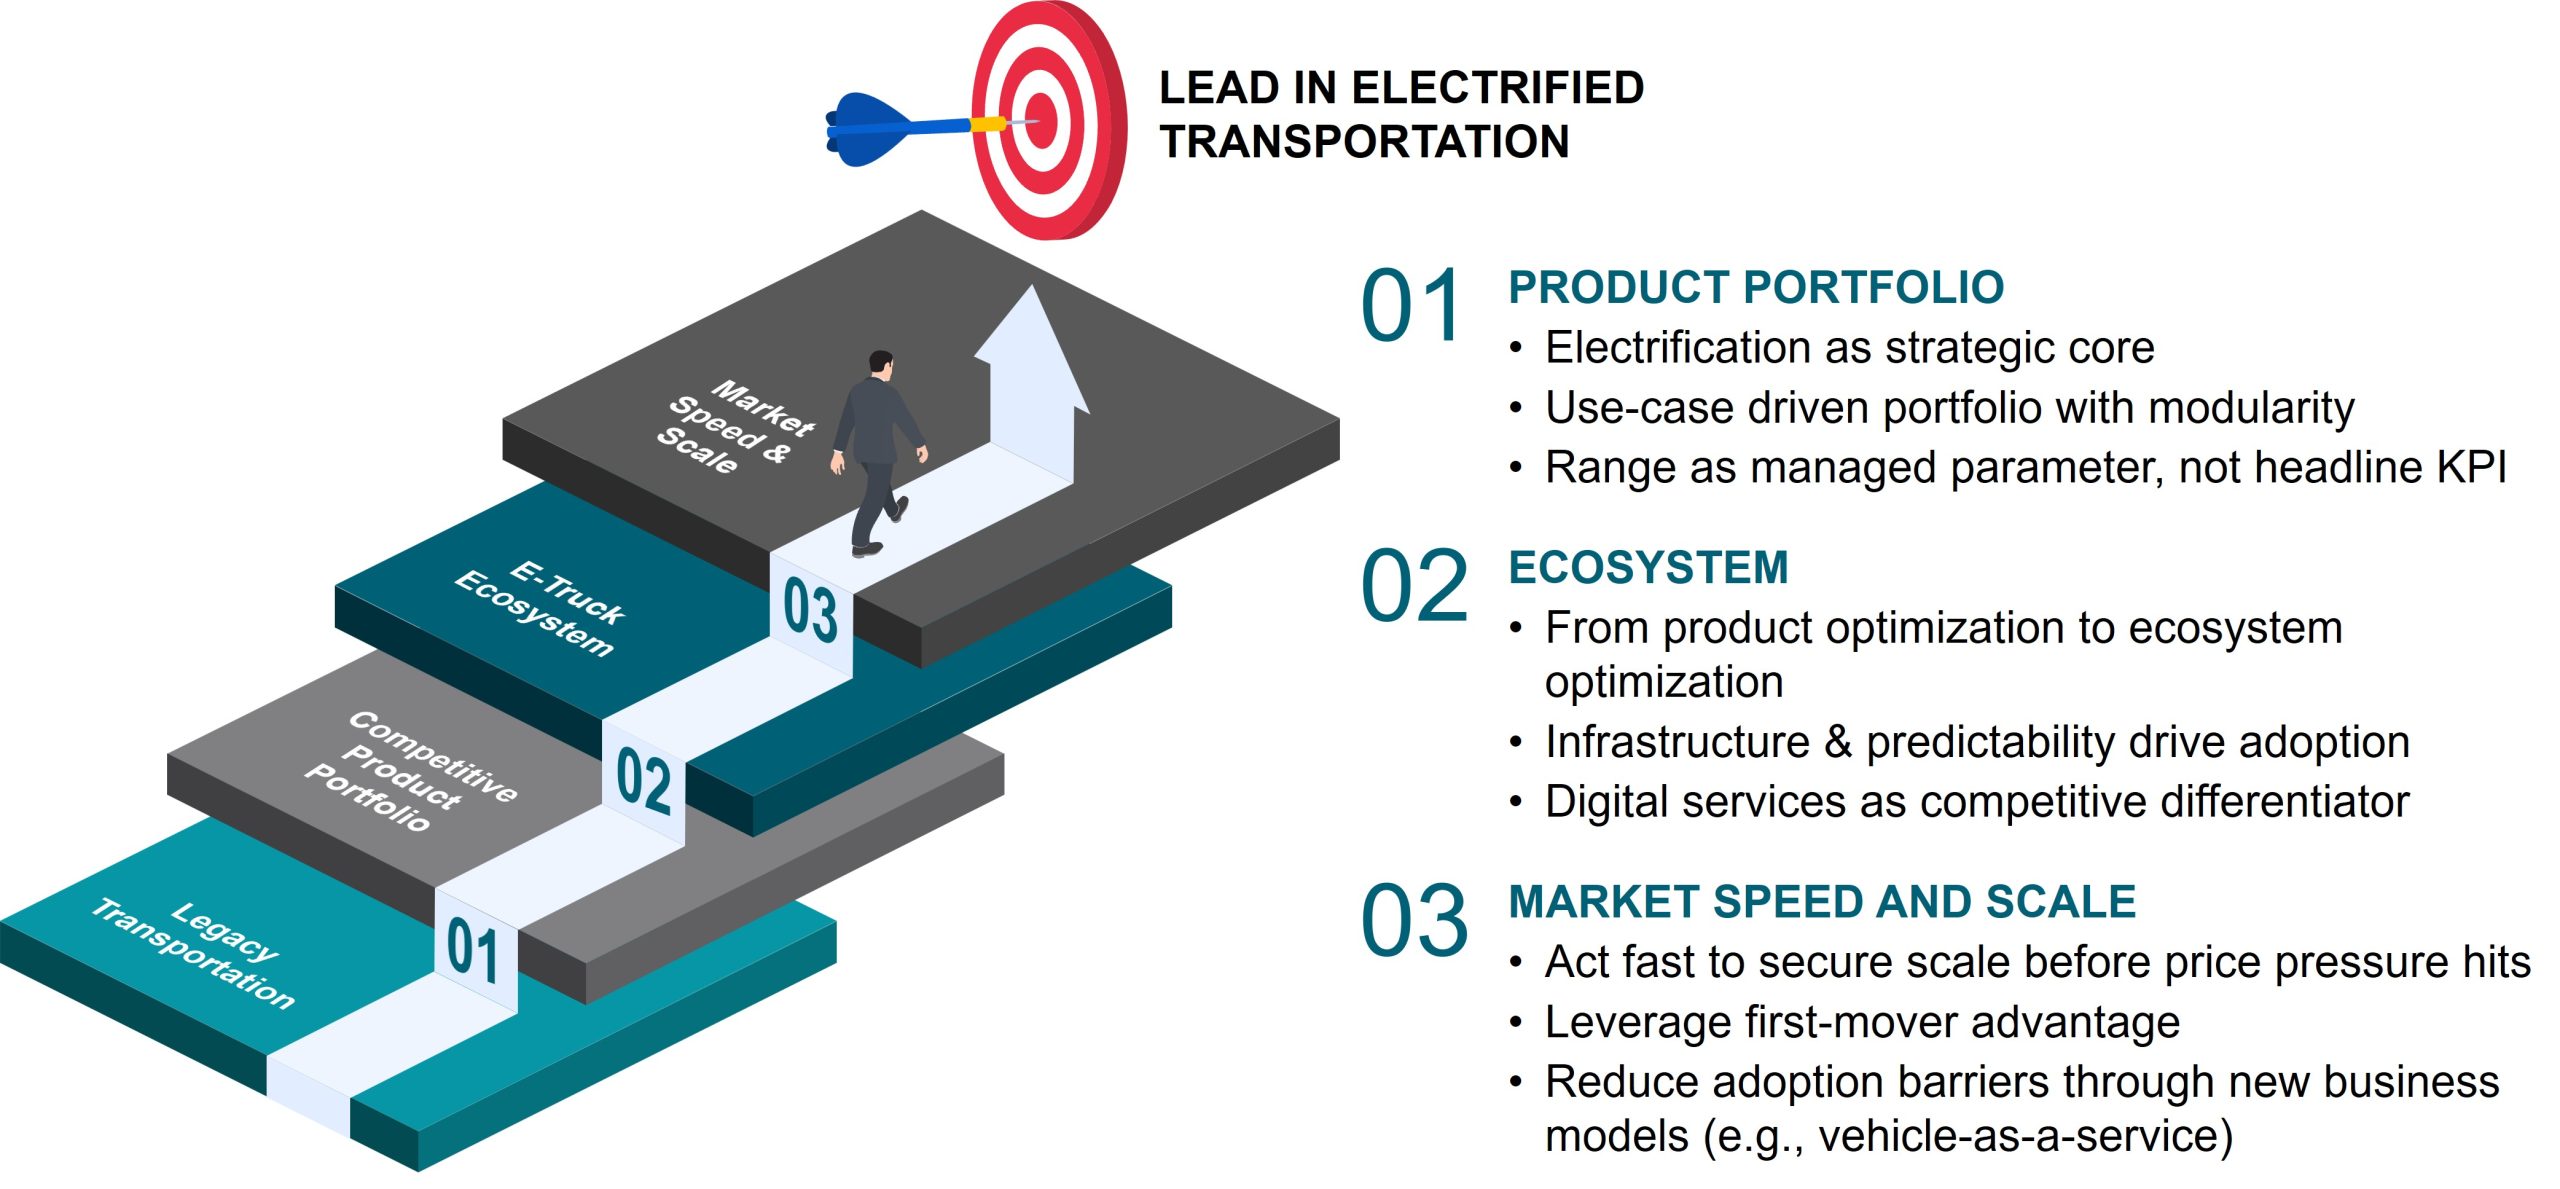
Battery electric trucks (BETs) are the next frontier in European electric mobility and the set of challenges faced by truck-makers is not identical, but it is very similar. There are three phases in BET adoption, and Europe’s OEMs need to get all of them right, before their Chinese competitors do:
Phase one: European OEMs need a product portfolio driven by actual use needs, not by competition over specifications
Phase two: they need to develop an ecosystem that delivers predictability in charging and service
Phase three: they need to scale fast, by breaking down adoption barriers
Here, we set out the actions truck-makers need to take now to master these three phases.
Three critical Phases for European Truck OEMs
Source: Berylls by AlixPartners
Product development for BEVs demands a ‘use case mentality’ that understands that vehicles are part of a larger electric mobility ecosystem, in which, firstly the vehicle must convince potential buyers. This is true of all BEVs and especially true of electric trucks. Manufacturers must develop the capabilities of their electric vehicles and the offered ecosystem around them, even while maintaining a portfolio of internal combustion engine (ICE) vehicles that compete on product specification. While the BEV is now established as the clear future mobility technology, truck OEMs can only expect their vehicles to succeed when recognized as components of a trusted electric ecosystem.
This means the development of BETs should be treated as the strategic core of the OEM’s business, not as ‘side project’ alongside a legacy ICE product core. This is particularly important for truck-makers, and leading EU OEMs are demonstrating this: for example, Traton now allocates at least 50% of its R&D budget to electrification, which is more than typical passenger car OEM spendings which are around 40%.
The use case is the primary product development factor for BETs. Trucks need to be developed for clearly defined purposes, from light urban delivery to heavy long-haul transport: there is no one-size-fits-all solution. Developing a compelling range of products adapted for defined use cases also makes modularity in design and production exceptionally important, to eliminate duplication of high-cost R&D.
In BET development range is not as important as for passenger cars. Many truck use cases involve either limited range needs (for example in limited areas of operation where charging availability is unrestricted) or highly predictable routes of operation (where charging infrastructure can be targeted). In any case the range capability of long-haul trucks already fulfills the hard criteria for a transport economy where driving time is limited by regulation, and where further range improvements will increase flexibility and the range of feasible and reliable operations.
European OEMs are already part of the way down this strategic route: all leading OEMs already have advanced BETs in their product portfolios, but there remain portfolio gaps where electric versions of trucks at competitive sticker prices and competitive total cost of ownership are still lacking.
To fill these gaps and secure positioning in what will soon become a more competitive market, Europe’s OEMs will need to do further work on developing the BET ecosystem. The ecosystem is more than the machine: it consists of vehicle, infrastructure and usage. A product-only focus is no longer enough to be competitive in an evolving market.
Charging networks driven by passenger car OEMs like the Ionity network available in 24 European countries, or the Tesla Supercharger network in 30 European countries, have already accelerated electric mobility infrastructure development, giving a strong usability signal to potential buyers. Comparable networks specific to BETs will have the same ecosystem-building effect.
Lean charging solutions for BETs focused on depot and en-route charging will leverage the predictability of truck usage and increase trust in the BET ecosystem. Furthermore, they can reduce the costs.
Digital solutions can further improve the ecosystem, making BET fleet management more efficient such as through time-shifted charging and charging optimization. OEMs will need to anticipate these services when developing their products within the ecosystem strategy.
Passenger car customers have exhibited a continued unwillingness to transition to BEV options because the combination of vehicle, accessible infrastructure and adaptation to usage is not considered sufficiently attractive: the ecosystem has not been perfected. For BETs the equation is more attractive due to the greater predictability of truck use, which is a fundamental advantage in the creation of a compelling ecosystem.
Offering attractive products at small volumes is not enough to establish market leadership; early high market penetration is needed to achieve emission targets and to enable the scale effects to compete with new players. European passenger car OEMs lacked speed and scale when launching their BEV portfolios, losing out on the scale effects that would reduce costs. This gap was rapidly filled by new competitors from China that undercut prices. Today, European truck OEMs have attractive BET products, but competition from China leveraging scale advantage is an imminent market threat.
European OEMs already have BETs in the market, and BETs are gaining market share. For example, around 10% of newly registered trucks in Germany are already electric (of which most are from European OEMs). Heavy duty commercial vehicles have lower sales shares, but are constantly growing. That demonstrates existing strength in an emerging product category, but it is not enough to secure a future position in BET manufacturing. Companies will need to improve availability of products and achieve high market penetration to keep the momentum going and to achieve the scale to succeed even if that means sacrificing short-term margins. Scale effects and learning curves define long-term profitability in electrification.
Manufacturers should address logistics buyer risk by rolling out vehicle-as-a-service offerings to improve cost predictability and boost BET sales in the early phase of this market.
Share of newly registered Electric Trucks is growing in Germany
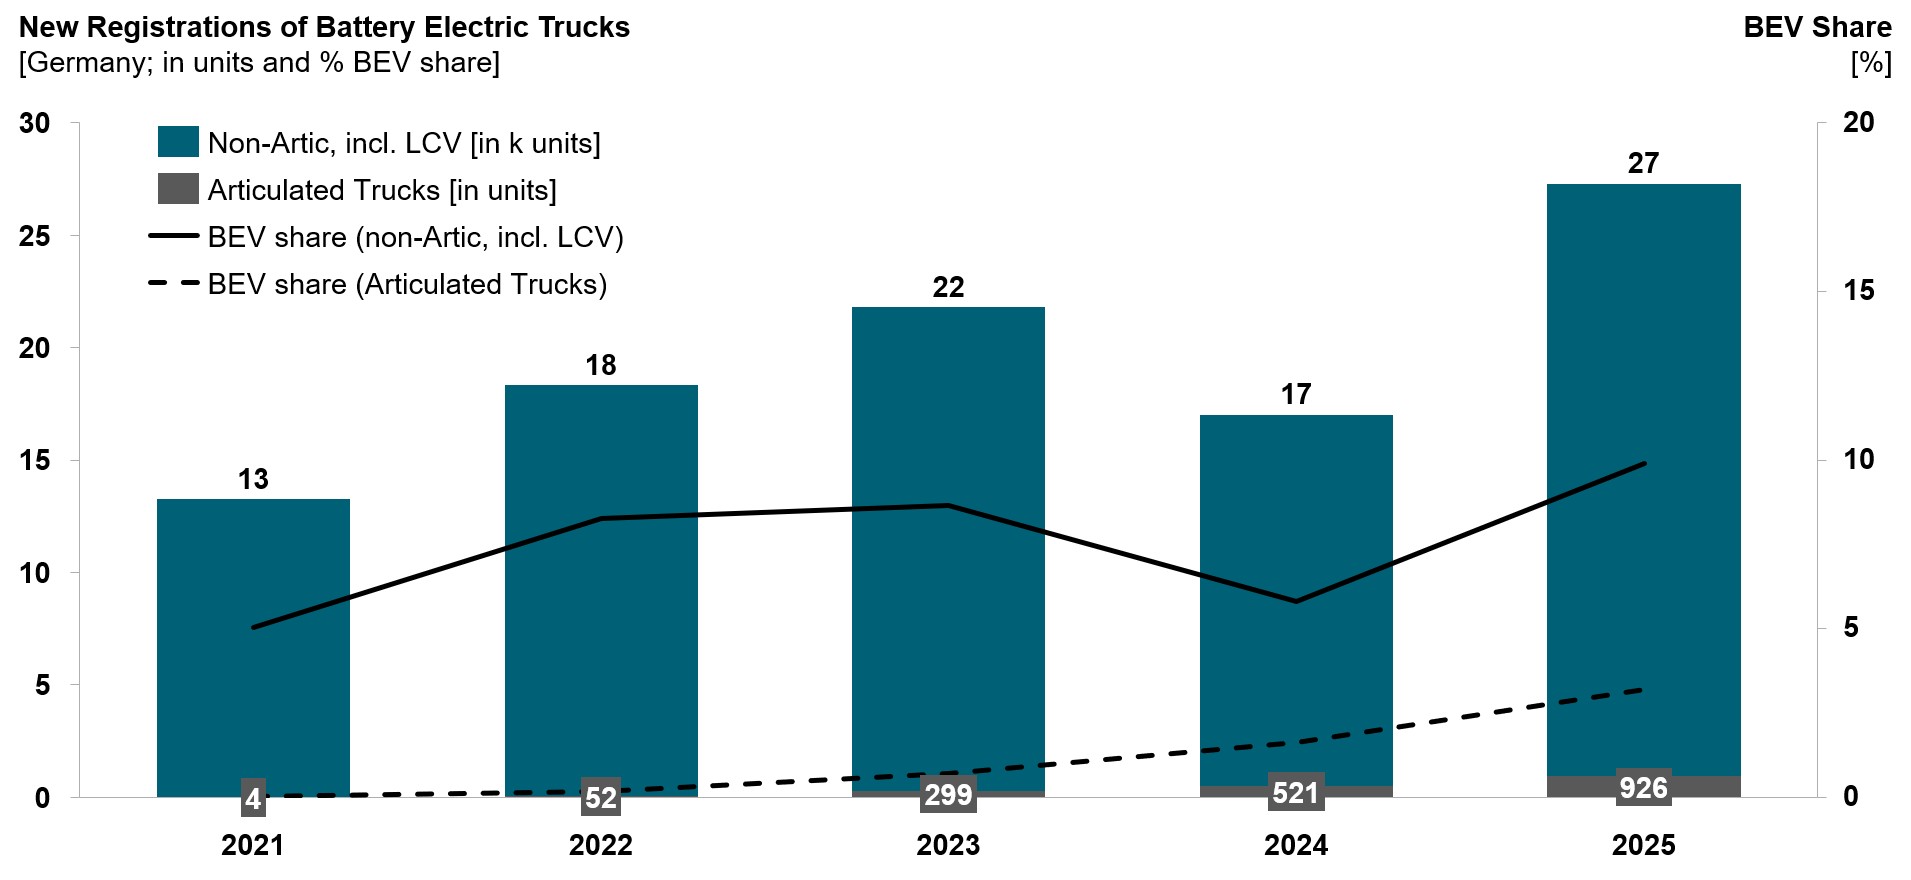
Source: Neuzulassungen, Kraftfahrt Bundesamt
Over the past decade, Chinese vehicle manufacturers have evolved from largely domestic players into globally relevant competitors. While this transformation has been widely discussed in the passenger car segment, a similar shift is now emerging in commercial vehicles. Driven by rapid advances in electrification, battery technology and vertically integrated value chains, several Chinese truck OEMs, including BYD, SANY and SuperPanther, are accelerating their push into Europe.
As of now Chinese battery electric truck (BET) manufacturers are not volume challengers in Europe. Despite strong domestic momentum (“New Energy Vehicle” trucks recently exceeded 50% market share in the Chinese market), their European volumes remain marginal, especially in medium and heavy-duty segments. However, focusing on current sales figures misses the point. What is unfolding is not a short-term export initiative, but a deliberate and multi-dimensional market build-up designed for scale.
The critical question for European incumbents is: are Chinese truck OEMs still niche players, or are they really emerging as credible long-term competitors to European legacy OEMs like Daimler Truck, MAN and Scania?
To understand the depth of this transformation, it is useful to examine four reinforcing layers of competitive market embedding.
Strategic Levers driving Chinese Truck OEMs’ entry into Europe’s Truck Market
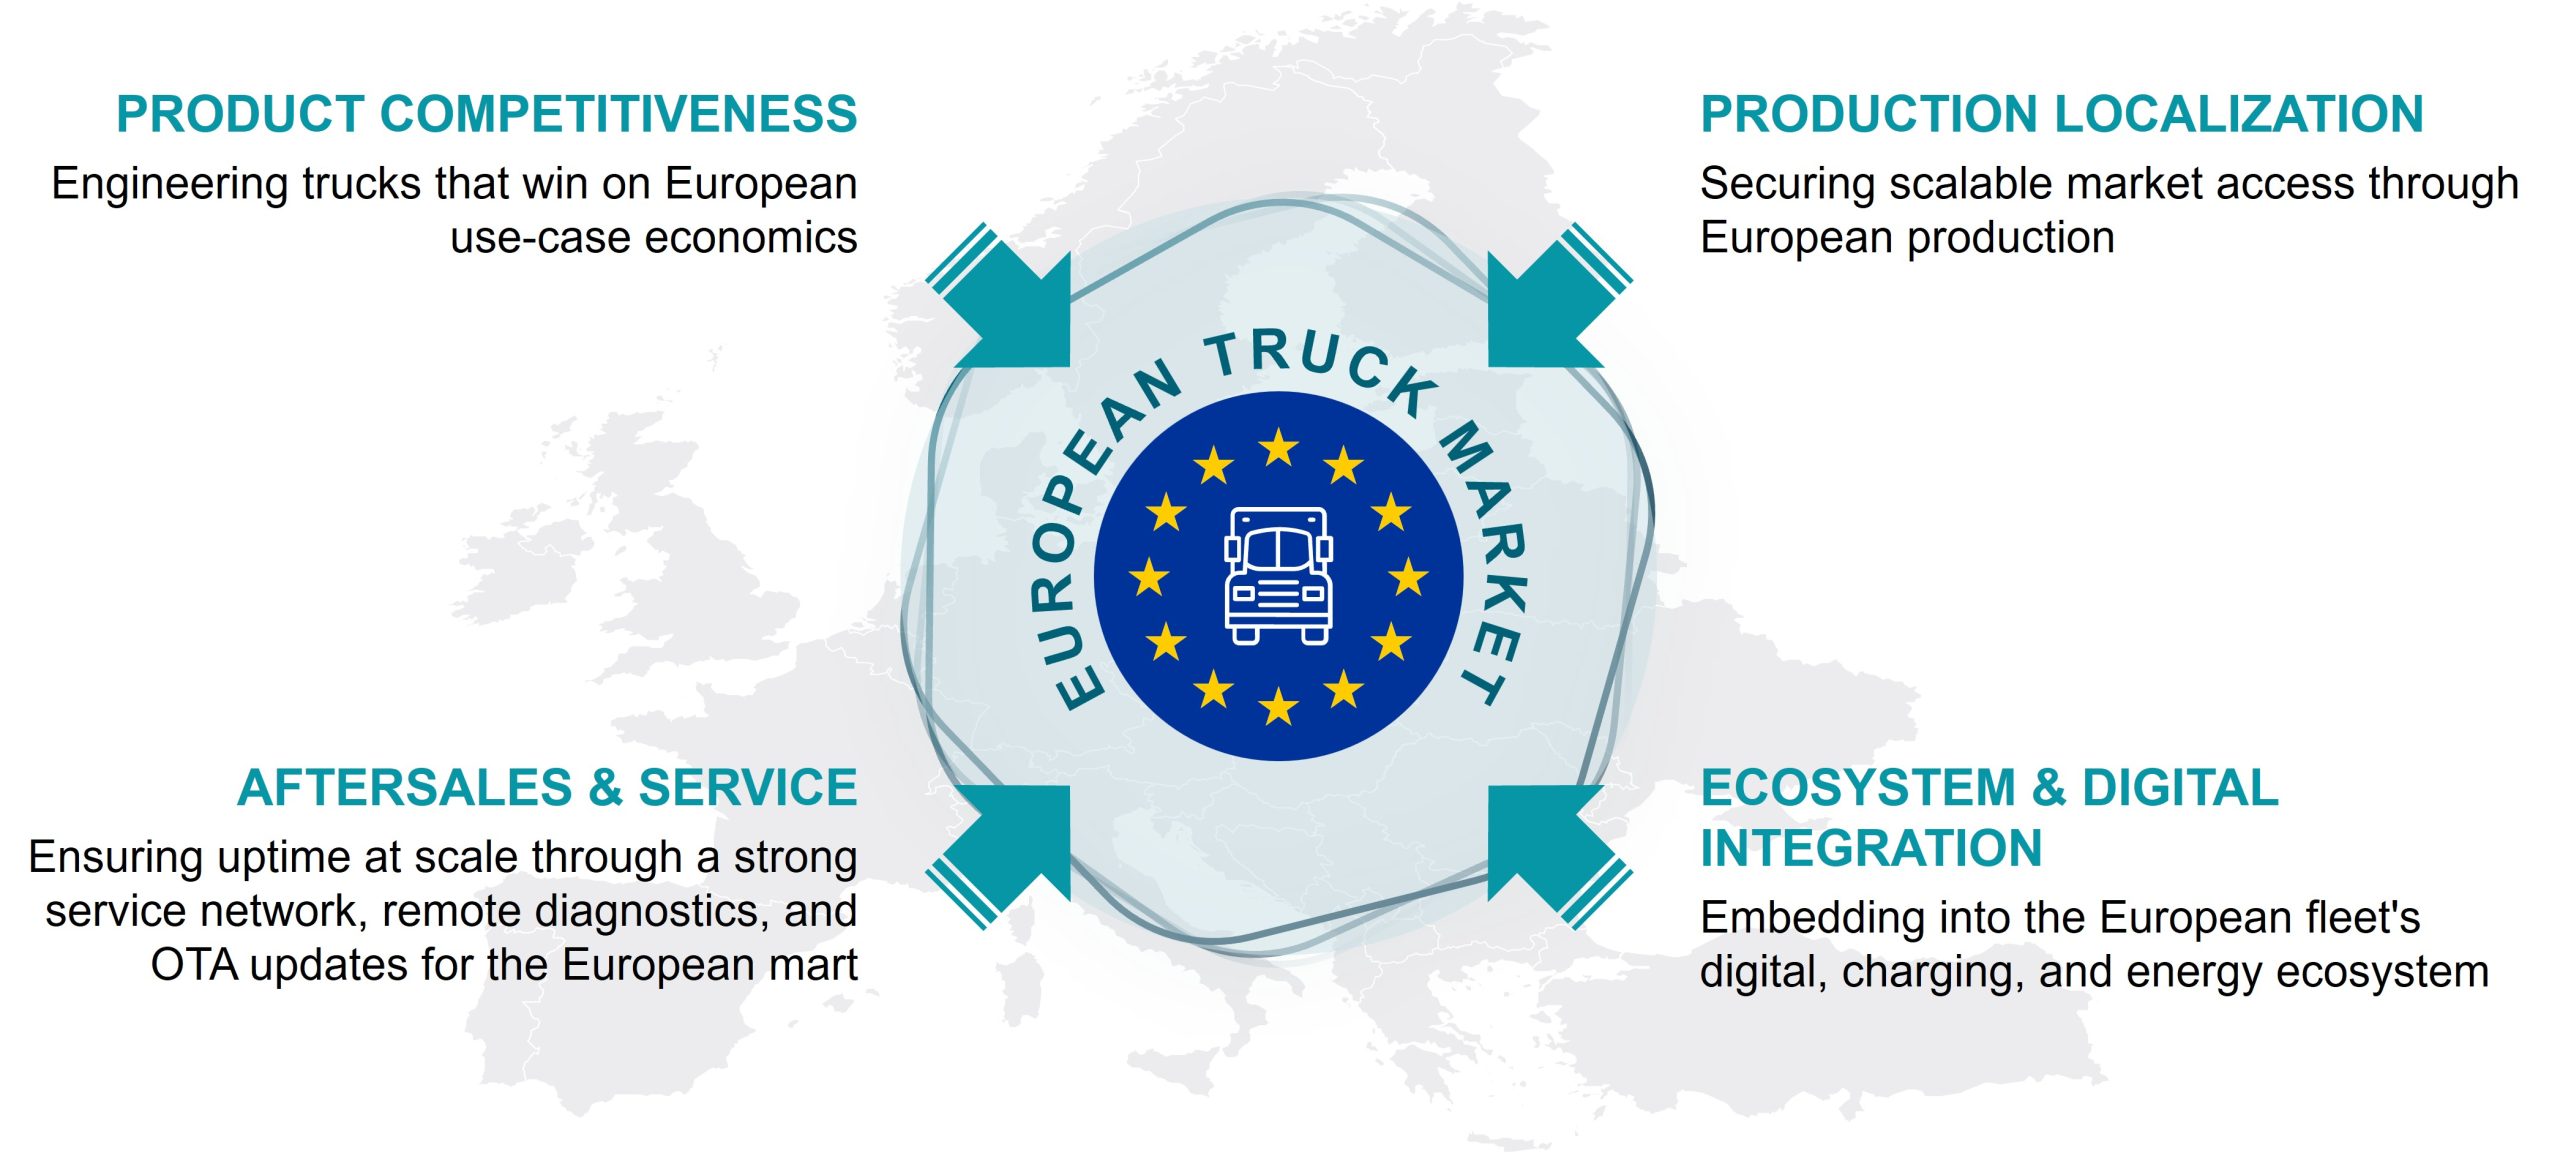
Source: Berylls by AlixPartners
Chinese BET OEMs have moved decisively beyond simple homologation adjustments. Rather than merely adapting vehicles to European regulatory standards, they increasingly design products around specific European duty cycles and fleet requirements.
Across all major truck segments, established European manufacturers are facing growing competition from Chinese OEMs, often at estimated price points equivalent to 50 to 60% of comparable European offerings.
In the heavy-duty segment for example, electric models such as the Mercedes-Benz eActros and the MAN eTGX are now confronted with new vehicles from manufacturers such as SANY and SuperPanther. On paper, these vehicles offer comparable performance and specifications to established European battery-electric long-haul trucks. However, it is real-world use cases, rather than technical specifications alone, that ultimately determine performance in terms of reliability, efficiency, and total cost of ownership (TCO).
Whether Chinese OEMs can consistently deliver at scale in Europe remains to be proven, but early signals are positive. SANY’s nomination for the International Truck of the Year 2026 highlights advanced technical features and a competitive TCO, while the results from initial long-term tests with logistics providers such as DHL Freight and Dachser show strong performance in real-world operations, including high scores for reliability, efficiency, and customer service.
Trucks from low-cost countries have existed for decades, but historically they lacked the product substance required for successful market entry in Europe. Chinese manufacturers are now increasingly closing this gap, offering operationally sufficient, use-case-optimized solutions at significantly lower acquisition costs. Although TCO has always been a guiding criterion in the (European) truck market, incumbent OEMs were able to sustain premium price levels through superior product substance, proven reliability, and strong residual value performance. If this qualitative gap continues to narrow and residual values of Chinese competitors hold up over time, the traditional premium justification weakens, potentially shifting purchasing decisions more decisively toward economic efficiency and cost competitiveness.
Product competitiveness alone is not enough in Europe. Chinese OEMs face tariffs, regulatory hurdles and political resistance when importing to Europe. Selected Chinese OEMs are therefore pursuing different localization strategies, not primarily as a cost lever, but as a mechanism to secure market access, political legitimacy, and long-term strategic positioning. Other OEMs continue to rely on imports for their European market entry.
Production Footprint of selected Chinese Truck OEMs serving the European Market
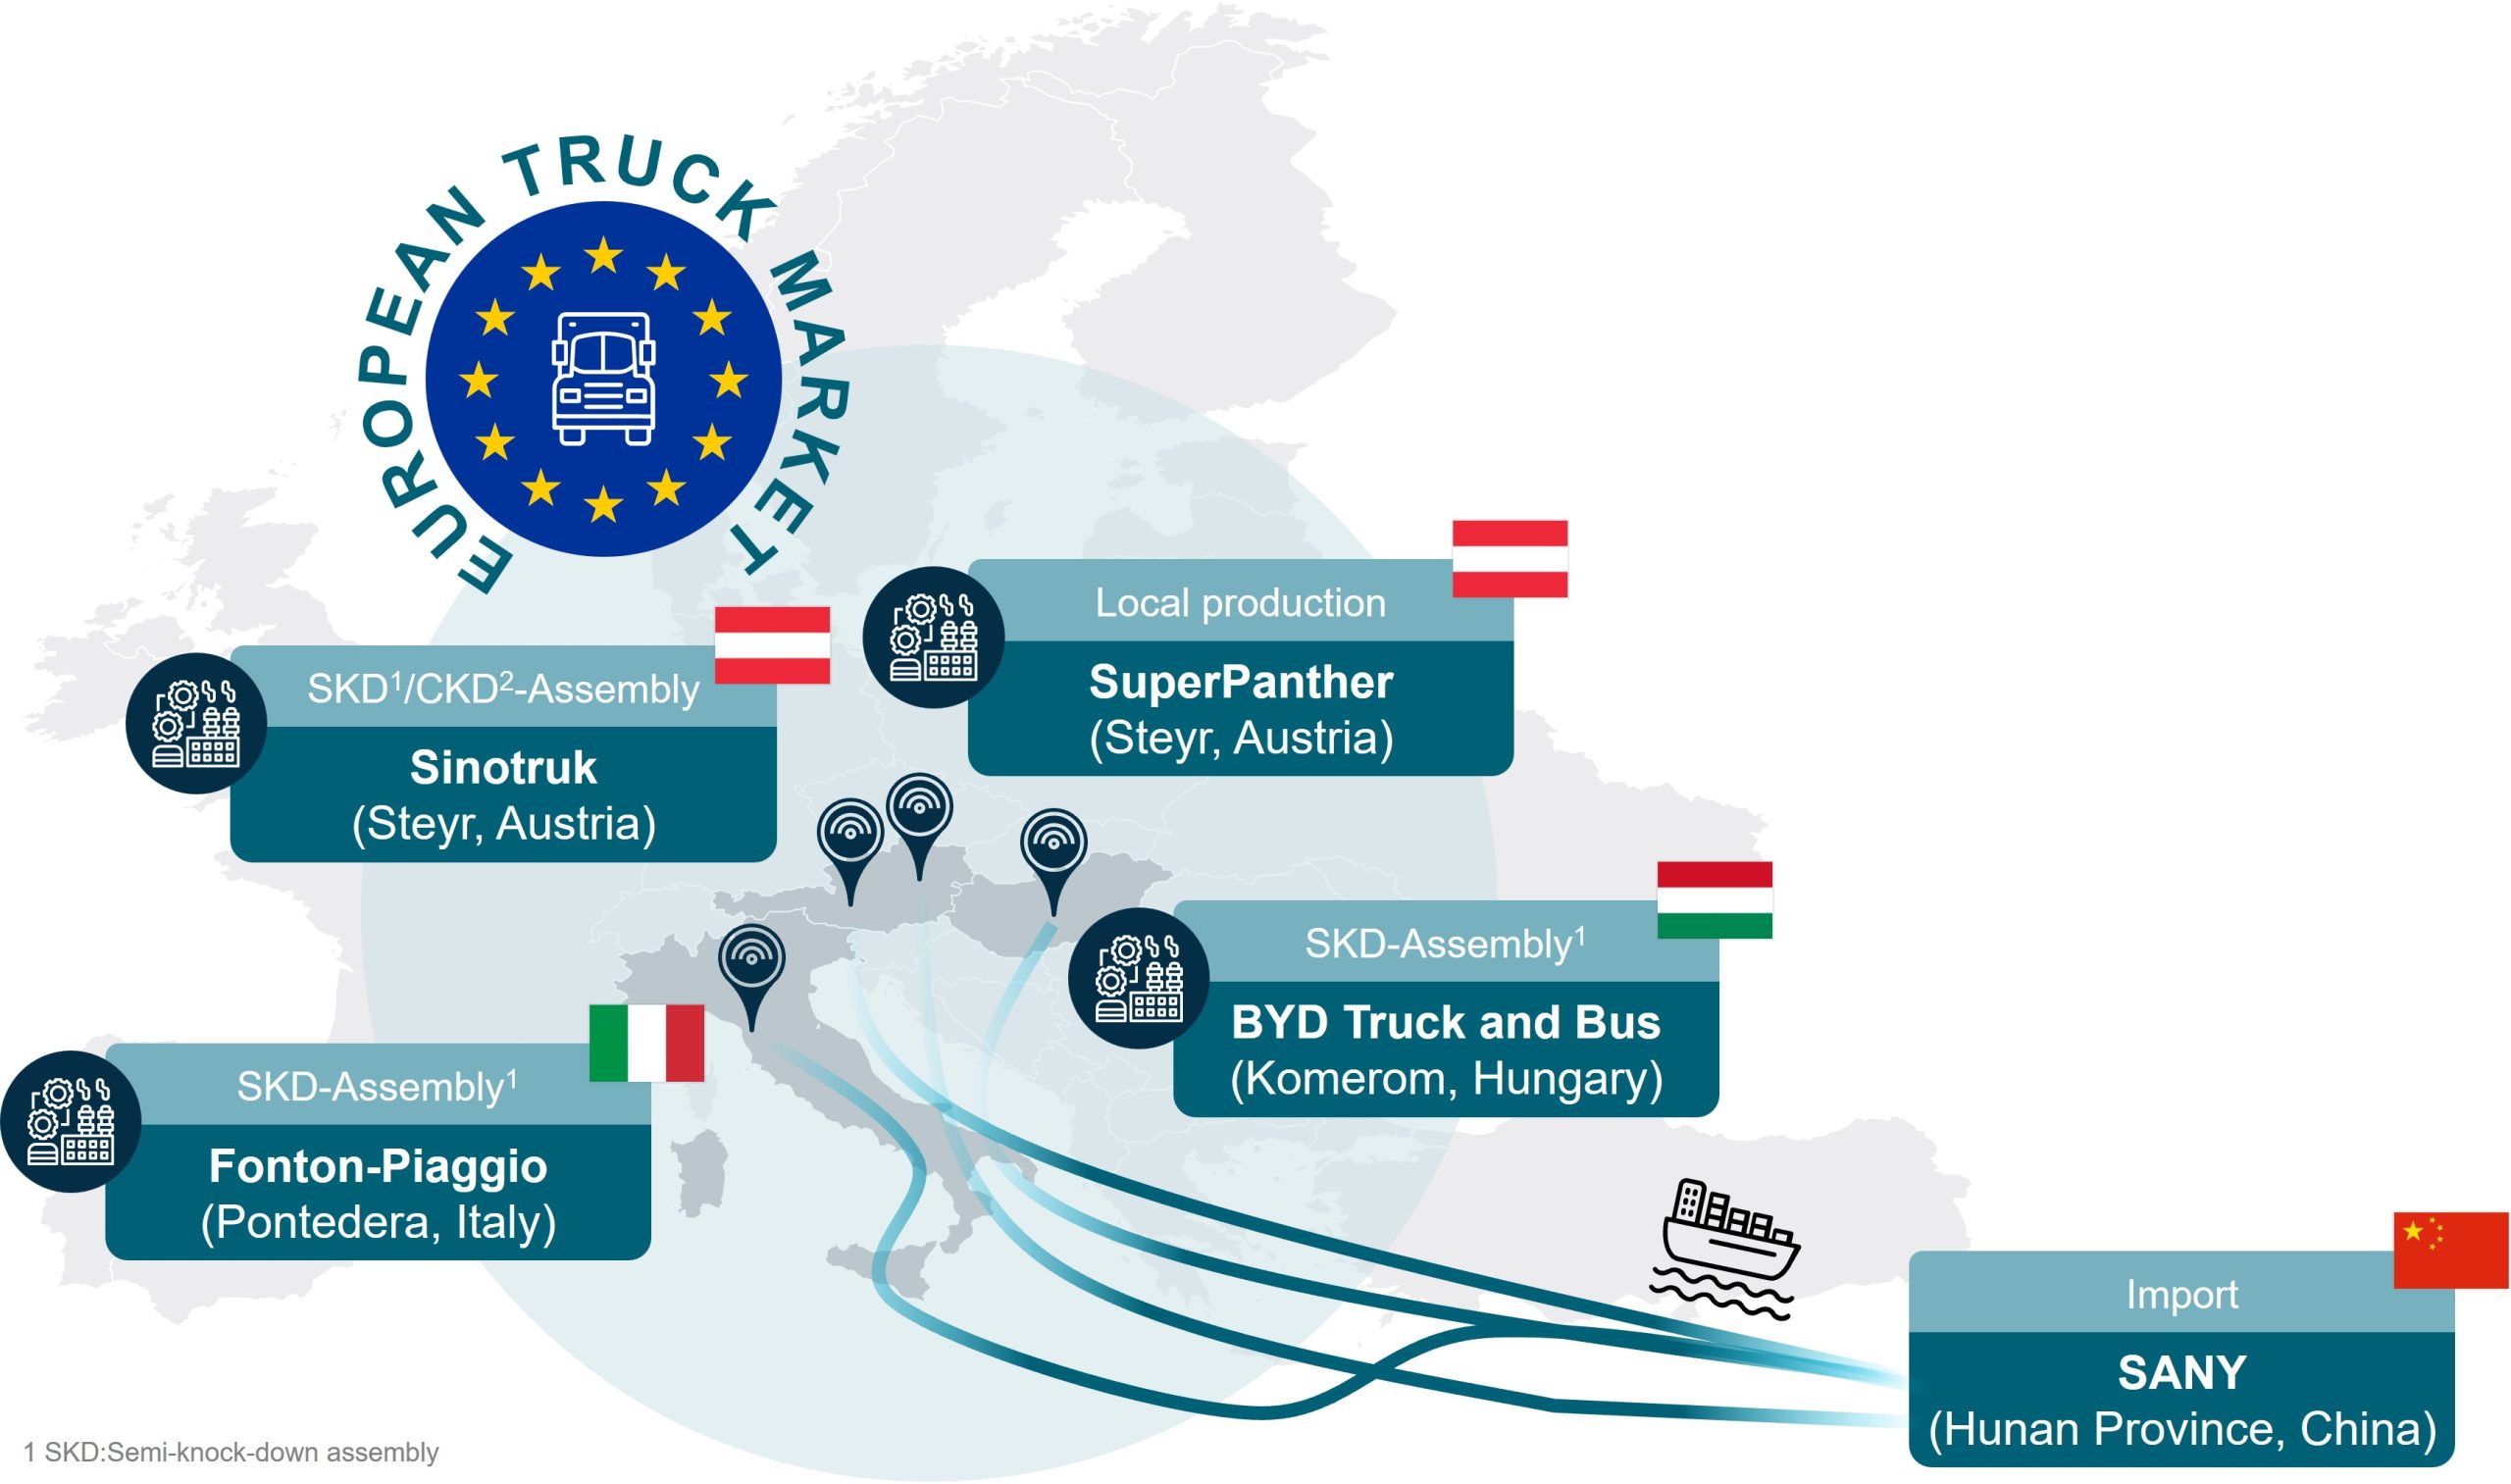
Source: Berylls by AlixPartners
Chinese OEMs are using multiple localization strategies in Europe, including:
Direct investment, such as BYD’s commercial vehicle plant in Hungary, building up full-scale production capacity for 1,250 battery electric trucks and buses within the EU annually. This model reduces exposure to tariffs and trade defense measures, ensures compliance with European industrial and procurement rules, shortens delivery times, and signals long-term commitment to regulators and fleet customers. However, it requires significant capital expenditure, scale assumptions, and long-term market confidence to justify the investment.
Partnership-based production, such as Foton’s cooperation with Piaggio, producing co-developed light commercial vehicles at Piaggio’s Pontedera plant in Italy, enables faster market entry by using existing European manufacturing infrastructure, workforce, and supplier networks. This approach lowers upfront investment, accelerates regulatory approval and ramp-up, and shares operational and financial risk between partners while maintaining access to local industrial credibility.
Contract manufacturing and SKD/CKD assembly, exemplified by SuperPanther’s semi-knocked-down (SKD) truck production at the Steyr plant in Austria (formerly a MAN production site), is a localization approach that enables speed, flexibility, and tariff resilience. The model allows rapid market entry with limited upfront investment, as vehicles are assembled locally from SKD kits that are sourced from China. Additional components are supplied by established European companies such as ZF, Schaeffler, Continental, and Aumovio, embedding the trucks within existing European supply chains and supporting quality perception and fleet acceptance. SuperPanther plans to sell up to 16,000 trucks in Europe by 2030 based on its proprietary platform. In parallel, Sinotruk (25% owned by MAN) also utilizes the Steyr plant for SKD production and is expected to transition toward complete knock-down (CKD) assembly over time, including the localization of cab manufacturing, to further increase the level of value creation on site and reduce tariff exposure.
Even while Chinese truck volumes in Europe remain marginal, the structural groundwork for scale is being laid in parallel.
In commercial vehicles, aftersales is a large part of the product promise. Vehicle uptime is not an optional feature, it is the business model, making service coverage the foundation for fleet adoption.
Historically, limited service networks represented a structural barrier for Chinese vehicles in Europe. Selected Chinese truck manufacturers are now addressing this limitation: SANY and SuperPanther have partnered with the Alltrucks service network which gives them access to over 700 service locations across Europe alongside 24/7 roadside assistance. While still significantly below the number of locations operated by major European OEMs (see chart below), this footprint provides a foundational level of coverage that enables initial market entry.
Number of Service Points per Truck OEM in Europe
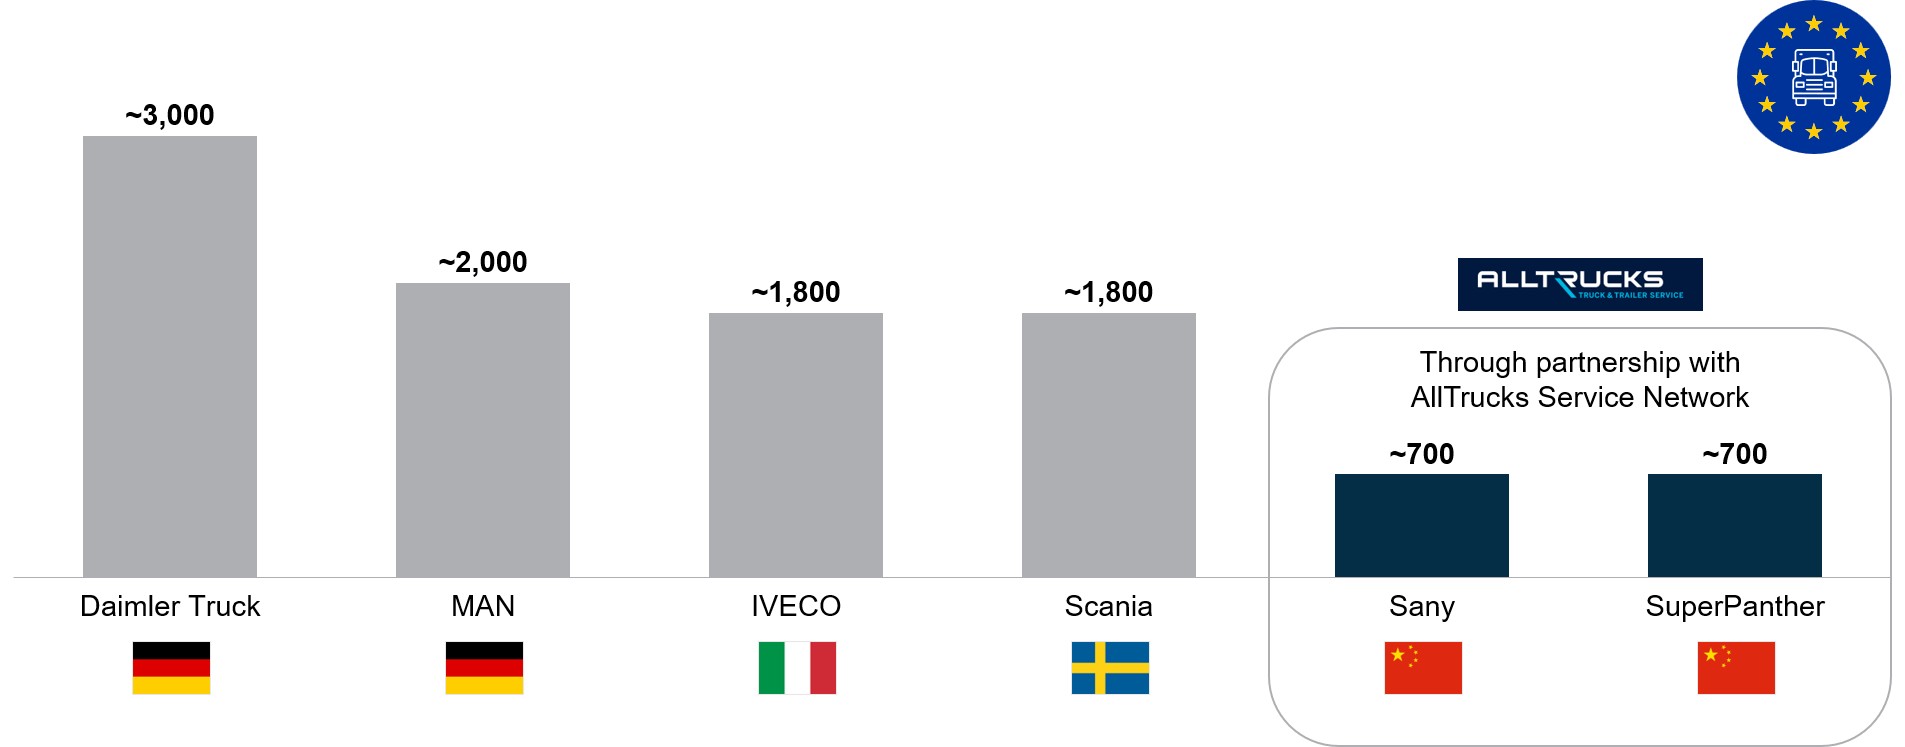
Source: Berylls by AlixPartners
Network size alone does not equate to service maturity. What ultimately determines competitive credibility is execution: spare parts availability, technician expertise, response times, warranty handling, and uptime performance under real operating conditions. These capabilities must still prove themselves at scale in European fleet environments. Aftersales is therefore not yet commoditized for Chinese OEMs. While the presence barrier is being addressed, operational credibility still needs to be proven under European fleet conditions.
The question is no longer whether Chinese OEMs can offer service coverage. It is whether they can deliver consistent uptime across European fleets.
Building a comprehensive ecosystem around truck operations has emerged as one of the central value drivers in the commercial vehicle market. Over recent years, European OEMs began to establish a structural advantage in their home markets by extending their offering well beyond the vehicle itself. What initially started with telematics and basic fleet monitoring evolved into integrated digital ecosystems encompassing charging infrastructure, energy services, fleet management, uptime solutions, and predictive maintenance, often enabled through close partnerships with infrastructure providers, roaming platforms, utilities, and software players.
Amid rising concerns about data leakage, espionage, and dependencies on Chinese players, this local advantage can become a significant differentiator for European OEMs. By relying on EU-based cloud infrastructure, localized data hosting, and clearly defined data sovereignty frameworks, European OEMs can offer a compelling alternative. For fleet operators, this combination translates not only into operational efficiency gains but also into increasing trust in data security, regulatory compliance, and long-term reliability. As a result, ecosystem integration and robust data governance are becoming implicit entry barriers for non-European OEMs – particularly in data-intensive and uptime-critical truck applications.
Chinese OEMs are now trying to close this gap. Rather than attempting to replicate European ecosystems from scratch, they pursue a pragmatic localization and partnership strategy. By leveraging established EU-based providers for telematics, charging management, roaming, and energy services, they can achieve functional ecosystem parity at greater speed and lower investment. BYD’s cooperation with Geotab, including vehicle data hosting on German servers, illustrates how Chinese OEMs are addressing regulatory requirements and trust considerations through third-party integration rather than proprietary platforms.
Chinese truck OEMs are embedding themselves into Europe’s commercial vehicle ecosystem earlier and more deeply than many incumbents anticipated. While they are not yet volume challengers, their structural market build-up and use-case-driven product localization position them as credible long-term competitors. What will ultimately determine the durability of this competitive shift in the coming years is their ability to demonstrate long-term reliability and sustainable residual value performance in European operations, so lower upfront acquisition costs truly translate into superior total cost of ownership. For European truck manufacturers, the implication is clear: the competitive challenge is no longer in the distant future. It is unfolding now – structurally, strategically, and at scale.
or the last five years, many OEMs, suppliers, and regulators have assumed a steep EV ramp-up and fast phase out of ICE demand and production.
This directed many investments along the value chain in products and capacity for EVs. Actual market development, however, requires course correction in the industry.
Geopolitical fragmentation, China’s cost and speed advantage, structural overcapacity, labor shortages, and the rise of AI are breaking the logic of the old operating model built on global efficiency, stable volume assumptions, and incremental optimization. We have derived six key themes that should be on top of the agenda of each COO.
ie Zuliefererbranche verliert ihre Finanzkraft genau in dem Moment, in dem sie die teuerste Transformation ihrer Geschichte finanzieren müsste.
Wer die Lage der Automobilzulieferer in diesem Jahr beschreiben will, könnte vieles anführen: sinkende Umsätze trotz steigender Produktionsvolumina, verzögerte Plattformanläufe, wachsender Druck aus Asien. All das stimmt. Aber es trifft nicht den Kern. Der Kern ist finanzieller Natur – und er ist besorgniserregender als die meisten öffentlichen Diskussionen vermuten lassen.
Der Zinsdeckungsgrad der Branche hat seit dem Post-Corona-Hoch kontinuierlich nachgegeben und liegt heute auf dem niedrigsten Stand seit Beginn der Elektrifizierungswelle. Die Investitionsquote der größten Zulieferer ist nach kurzer Erholung auf den tiefsten Wert seit mindestens acht Jahren gefallen. Beide Entwicklungen sind keine zyklischen Dellen. Es sind Signale einer strukturellen Verschiebung, die in ihrer Konsequenz unterschätzt wird. Die Zuliefererbranche verliert ihre Finanzkraft genau in dem Moment, in dem sie die teuerste Transformation ihrer Geschichte finanzieren müsste.
trategien für Automobilzulieferer weltweit im Verbrenner-Endspiel und welche Prioritäten sich für DACH-Zulieferer ergeben
Der Verbrenner verschwindet nicht weltweit im Gleichschritt. Während die Fahrzeugproduktionglobal im Light-Vehicle-Markt bis 2040 von heute rund 93 auf etwa 106 Mio. Fahrzeuge wächst, fällt das jährliche Verbrenner-Neugeschäft im gleichen Zeitraum von gut 54 auf rund 16 Mio. Fahrzeuge.
Der Verbrenner-Markt schrumpft allerdings nicht nur – er verlagert sich auch in den globalen Süden.Während er in Europa und China bis 2040 in die Marginalität abgedrängt wird, verbleiben in Südasien dagegen von heute rund 8,6 Mio. Einheiten bis 2040 weiterhin rund 6,5 Mio. Einheiten Verbrenner. Damit wird Südasien zum größten verbleibenden Verbrenner-Markt. Lateinamerika sowie Middle East & Afrika liegen 2040 bei 2,2 bzw. 1,2 Mio. Verbrennern.
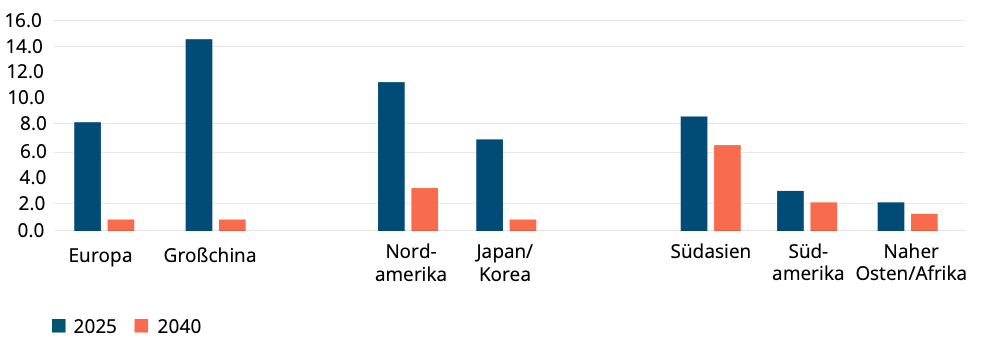
Quelle: Berylls by AlixPartners
Rund zwei Drittel des globalen Verbrenner-Restvolumens liegen damit künftig außerhalb der traditionellen Kernmärkte europäischer Automobilzulieferer, wo der Verbrenner als lokal angepasster, kostengünstiger Antrieb präsent bleibt – vor allem in Volumen- und Einstiegssegmenten. Chinesische Vorbilder für Zulieferer wie Geely treiben die aktuelle Entwicklung in der Automobilindustrie zusätzlich, indem sie exportorientierte Multi-Energy-Plattformen aufbauen, wobei die Verbrenner-Anteile gezielt für Märkte in Afrika, Südamerika und Südostasien ausgelegt sind.
Ab einem Non-Auto-Anteil von 20 bis 40 Prozent verbessert sich die Profitabilität hingegen spürbar. Auch in den Gruppen mit 40 bis 60 Prozent sowie 60 bis 80 Prozent Non-Auto-Anteil liegen die EBIT-Margen deutlich über dem Niveau reiner Auto-Player. Die Auswertung spricht damit dafür, dass nicht der vollständige Ausstieg aus dem Automobilgeschäft die größten Effekte bringt, sondern ein relevanter Diversifikationsgrad, der zusätzliche Ertragsquellen erschließt und die Abhängigkeit vom zyklischen Kerngeschäft reduziert.
Entscheidend ist daher, welche Produkte im Verbrenner-Endspiel für Zulieferer noch tragen. In Motor-Kernkomponenten wie Kolben, Lagern oder Schwungrädern oder auch dem Thermomanagement halten Unternehmen aus der DACH-Region heute häufig hohe Marktanteile. Genau in solchen Komponenten liegen die belastbarsten Brückensegmente. Sie bleiben im Restmarkt gefragt und lassen sich teilweise in Hybrid- und E-Antriebslösungen weiterführen. Hochkomplexe und durch Regulierung beeinflusste Komponenten wie die der Abgasnachbehandlung bleiben dagegen in wenigen Märkten und Nischen relevant.
Auch der Footprint muss neu gedacht werden. OEMs stellen europäische Automobilwerke auf BEV-Plattformen um, während viele Zulieferkapazitäten in Hochlohnländern weiterhin an den klassischen Verbrenner gebunden sind. Während am Standort Deutschland im großen Stil Werke abgebaut werden, sollten europäische Lieferanten in neuen Automobil-Clustern, wie Indien, Mexiko sowie einzelnen nord- und südafrikanischen Ländern modulare Standorte eröffnen. Diese bedienen das verbleibende Verbrenner-Volumens einerseits und lassen sich andererseits mittelfristig auf Hybrid-Technologien sowie Komponenten für die Elektromobilität umrüsten.
Der längste Schatten des Verbrenners liegt jedoch im Bestand. Bereits vor der Pandemie wurden jährlich mehr als zwei Mio. Gebrauchtfahrzeuge nach Afrika exportiert. Daher wächst Afrikas Verbrenner-Fahrzeugpark in typischen Szenarien von heute gut 30 Mio. Fahrzeugen auf 60–70 Mio. bis 2040, während der Bestand in Europa deutlich und zügig sinkt.
Dadurch verlagert sich auch das Aftermarket-Potenzial. Hierbei fungiert der Automotive Aftermarket als echter Stabilitätsanker. Ersetzt werden vor allem sicherheits- und funktionskritische Komponenten wie Bremsen, Licht, Batterien, Starter und Filter; beschädigte Karosserie-, Auspuff- und Komfortteile werden deutlich häufiger repariert oder ignoriert.
Genau in diesen ersetzungsstarken Aftermarket-Kategorien verfügen viele DACH-Zulieferer über technologische Kompetenz und starke Marken. Darin liegt das zweite strategische Standbein des Verbrenner-Endspiels: nicht die Verlängerung des alten OE-Modells (Original Equipment bzw. das klassische Erstausrüster-Geschäft direkt mit den Automobilherstellern), sondern der gezielte Aufbau von IAM-Wertpools (Independent Aftermarket bzw. Marktpotenziale im freien, unabhängigen Ersatzteilgeschäft) in Afrika und Teilen Lateinamerikas.
Für DACH-Zulieferer ergibt sich daraus eine klare Priorität: Restmärkte selektiv bedienen, Brückentechnologien monetarisieren, Automobilwerke auf Umbaufähigkeit ausrichten und Aftermarket-Kategorien mit hoher Ersetzungswahrscheinlichkeit systematisch erschließen. Der Verbrenner endet damit nicht abrupt – er ordnet den Regional-Fokus, die Portfolios und die Geschäftsmodelle neu.
ie Geschäftsmodelle vieler Automobilzulieferer stehen seit Jahren unter erheblichem Druck. Hohe Transformationskosten, anhaltender Preisdruck seitens der OEMs und strukturelle Überkapazitäten belasten die Profitabilität.
Vor diesem Hintergrund rückt für viele Unternehmen die Frage in den Fokus, wie sich bestehende Kompetenzen über das klassische Automobilgeschäft hinaus in zusätzlichen Industrien einsetzen lassen.Dieser tiefgreifende Strukturwandel in der Automobilindustrie zwingt die Akteure dazu, traditionelle Wertschöpfungsketten aufzubrechen.
Ein Blick auf Margenentwicklung, Ergebnisstabilität und Kapitalmarktindikatoren legt nahe, dass die Top 100 Automobilzulieferer weltweit mit einem substanziellen Engagement außerhalb des Automobilsektors im Durchschnitt robuster aufgestellt sind als reine Automotive-Spezialisten. Kompetenzen aus Bereichen wie Elektronik, Antriebstechnik oder Bremssystemen lassen sich auch in Industrien wie Energie, Luftfahrt oder Agrartechnik nutzen und dort für zusätzliches Wachstum erschließen.
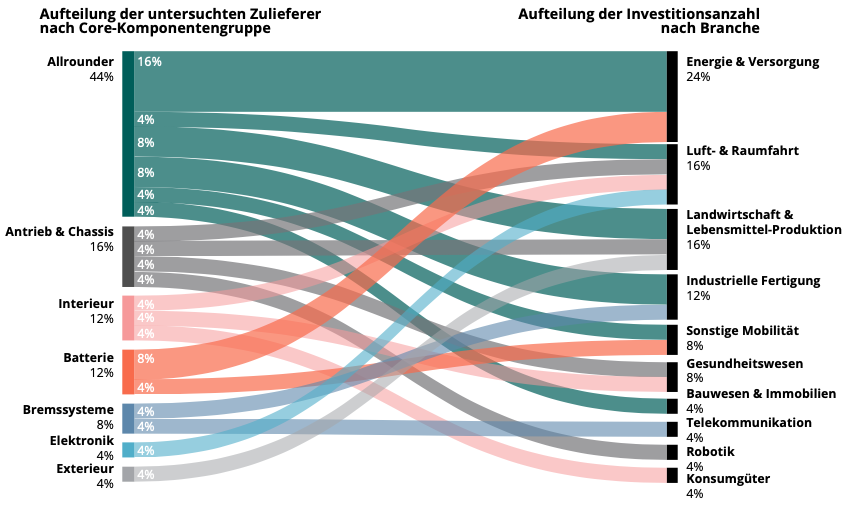
Quelle: Berylls by AlixPartners
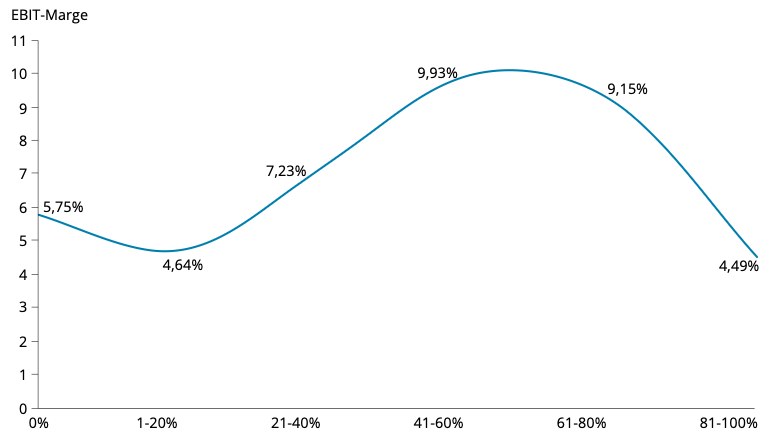
Die durchschnittlichen EBIT-Margen der Top-100-Zulieferer im Jahr 2025 zeigen einen erkennbaren Zusammenhang zwischen Non-Auto-Umsatzanteil und Profitabilität. Reine Automotive-Zulieferer bewegen sich im Schnitt im mittleren einstelligen Prozentbereich. Ein geringer Non-Auto-Anteil von 1 bis 20 Prozent verbessert dieses Bild noch nicht zwangsläufig. Das kann darauf hindeuten, dass erste Diversifikationsschritte zunächst zusätzliche Komplexität erzeugen, ohne bereits ausreichend Skaleneffekte oder operative Synergien zu realisieren.
Abbildung 2 – Diversifikationsgrad und EBIT-Marge 2025 für TOP 100 Zulieferer
Quelle: Berylls by AlixPartners
Ab einem Non-Auto-Anteil von 20 bis 40 Prozent verbessert sich die Profitabilität hingegen spürbar. Auch in den Gruppen mit 40 bis 60 Prozent sowie 60 bis 80 Prozent Non-Auto-Anteil liegen die EBIT-Margen deutlich über dem Niveau reiner Auto-Player. Die Auswertung spricht damit dafür, dass nicht der vollständige Ausstieg aus dem Automobilgeschäft die größten Effekte bringt, sondern ein relevanter Diversifikationsgrad, der zusätzliche Ertragsquellen erschließt und die Abhängigkeit vom zyklischen Kerngeschäft reduziert.
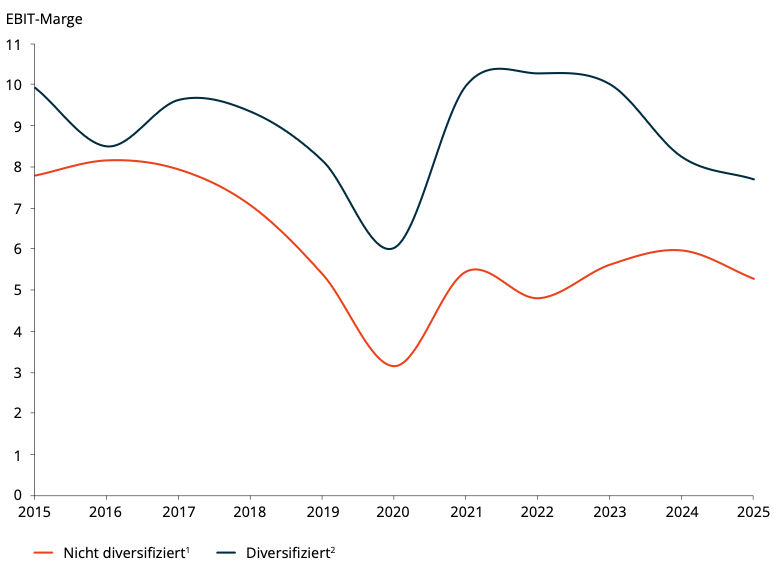
Auch im längerfristigen Vergleich über die vergangenen zehn Jahre zeigt sich ein differenziertes Bild, das den anhaltenden Strukturwandel der Automobilindustrie verdeutlicht. Die EBIT-Margen reiner Core-Auto-Player haben sich im Zeitraum von 2015 bis 2025 insgesamt abgeschwächt. Diversifizierte Unternehmen reagieren zwar ebenfalls auf Branchenzyklen und makroökonomische Schocks, stabilisieren sich im Zeitverlauf jedoch schneller und auf einem höheren Niveau. Die Entwicklung deutet darauf hin, dass eine strategische Diversifikation in der Automobilindustrie nicht nur zusätzliche Wachstumsoptionen schaffen kann, sondern auch dazu beitragen kann, Ergebnisvolatilität in einem zunehmend unsicheren Marktumfeld zu begrenzen.
Abbildung 3 – Entwicklung der EBIT-Margen von diversifizierten und nicht diversifizierten TOP 100 Automobilzulieferern 2015-2025 (in %)
Quelle: Berylls by AlixPartners
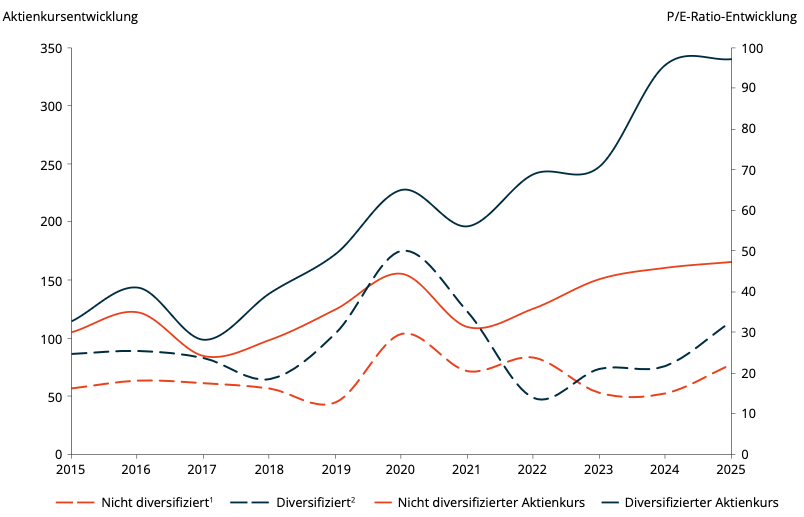
Ein ähnliches Bild zeigt sich am Kapitalmarkt. Diversifizierte Zulieferer verzeichnen langfristig häufig eine dynamischere Aktienkursentwicklung als reine Automotive-Player. Gleichzeitig liegen ihre Kurs-Gewinn-Verhältnisse in vielen Beobachtungszeiträumen über denen weniger breit aufgestellter Unternehmen. Das spricht dafür, dass Investoren Geschäftsmodelle mit stabileren Cashflows, breiterer Endmarktexponierung und mehreren Wachstumspfaden tendenziell mit Bewertungsaufschlägen honorieren.
Abbildung 4 – (Non)-Auto P/E Ratio und Aktienkursentwicklung (2015-2025)
Quelle: Berylls by AlixPartners
Für Managementteams ist Diversifikation keine punktuelle Entscheidung, sondern ein strategisches Transformationsprogramm. Die Top-Zulieferer priorisieren wenige attraktive Zielindustrien anhand von Marktattraktivität, Capability Fit, regulatorischen Rahmenbedingungen und Synergien zum Kerngeschäft. Entscheidend ist dabei auch der richtige Zeitpunkt: Der Schritt hin zu einem breiter aufgestellten Technologieanbieter lässt sich vor allem dann wirksam vorantreiben, wenn Unternehmen noch über finanziellen Handlungsspielraum verfügen.
Die Analyse der Top 100 Automobilzulieferer weltweit legt nahe, dass ein substanzieller Non-Auto-Umsatzanteil mit höherer Profitabilität, größerer Ergebnisstabilität und einer tendenziell höheren Kapitalmarktbewertung einhergehen kann. Um den Strukturwandel der Automobilindustrie aktiv mitzugestalten, erscheint damit für viele Automobilzulieferer als potenziell relevanter strategischer Hebel, um Abhängigkeiten zu reduzieren und zusätzliche Wertschöpfung zu schaffen.
Entscheidend ist jedoch nicht die Breite des Portfolios an sich, sondern die Fähigkeit, angrenzende Märkte auf Basis bestehender Kompetenzen profitabel und skalierbar zu entwickeln.
ach dem Durchbruch in generativer KI haben führende Tech-Player hochentwickelte KI-Modelle für Autonomes Fahren (auch Autonomous Driving oder kurz AD) und Advanced Driver Assistance Systems (ADAS bzw. hochentwickelte Fahrerassistenzsysteme) in den Markt gebracht.
Das ist revolutionär, da Vision-Language-Action(VLA)-Modelle heute bereits Infotainment, User Interface und Fahrfunktionen in einem Ansatz integrieren. Sie bündeln vormals getrennte Funktionssilos in einem einheitlichen ADAS-Software-Stack. Dies zwingt insbesondere Automobilzulieferern die Frage auf, welche Chancen und Risiken daraus erwachsen.
Jeder „tradierte Player“ in diesem Bereich ist mittlerweile alarmiert! Denn hier spielen drei Dynamiken eine zentrale Rolle: (1) Zero-Shot-Fähigkeiten, (2) massive Technologieinvestitionen und (3) der frühe Einstieg in eine langfristige Marktentwicklung.
Aktuell entstehen in der KI-Entwicklung Weltmodelle, die ADAS-Systemen eine nahezu menschliche Situationswahrnehmung ermöglichen. Dies senkt den Bedarf an aufwändigen (und damit teuren) Corner-Case-Trainingsdaten deutlich und ermöglicht Zero-Shot-Einsätze – also autonomes Fahren in Städten, für die nie explizit trainiert wurde. Erste Demos für L4-Systeme zeigten bereits Waymo, NVIDIA, NIO und insbesondere Wayve, die auf einer globalen Roadshow in 500 Städten mit einem einzigen KI-Modell Testfahrten vorstellten.
Ermöglicht wird diese Transformation in der Automobilbranche durch massives Entwicklungskapital: Allein Waymo verfügt mit einer Neufinanzierung von rund 16 Milliarden Dollar im Februar 2026 über Technologieinvestitionskapital in einer Größenordnung, welche die jährlichen F&E-Budgets vieler globaler Tier‑1-Zulieferer übersteigt. Das schafft einen strukturellen Geschwindigkeitsvorteil gegenüber den klassischen Automobilzulieferern. Und: Es schürt den Wettkampf zwischen den Tech-Playern um die Innovationsführerschaft im Autonomen Fahren Level 4.
Um zu gewinnen, treiben Tech-Unternehmen ihre vertikale Integration konsequent voran und reduzieren Abhängigkeiten von Zulieferern an kritischen Kontrollpunkten, wie insbesondere der SoC-Entwicklung und der Sensorik.
Demgegenüber verfügen traditionelle Automobilzulieferer weder über vergleichbare Mittel noch über eine entsprechend nötige Attraktivität für Investoren – aktuelle Renditeprofile und eine niedrigere Innovationsleistung limitieren die Teilnahme am Wettbewerb.
Warum ist dies genau jetzt entscheidend? First Mover sichern sich heute Marktchancen im ADAS-Umfeld, selbst wenn sich dies „nur“ im Bereich von autonomes Fahren Level 2 (also teilautomatisierten L2++Systemen) abspielt. Der jetzige Vertriebserfolg sichert nämlich die Eintrittskarte in den Langzeitmarkt – denn Aufwärtsskalierung zu höheren SAE-Leveln (den standardisierten Stufen von Stufe 0 bis Stufe 5 für das autonome Fahren) und das Wachstum mit entsprechenden Fahrzeugplattformen der relevanten Automobilhersteller sichern die Teilnahme am AD-Endgame. Dort werden Tech-Player die Robotaxi-Marktdurchdringung dominieren.
Parallel dazu steigt die Marktdurchdringung von ADAS rasant: In den Kernmärkten EU, USA, CN sind 2026 bereits rund 56 % der Neufahrzeuge mit L2/L2+/L2++‑Systemen ausgestattet – dies wird bis 2030 ansteigen auf gut 70 % und perspektivisch 2040 auf über 85 %. Der Folgeeffekt: Mit zunehmender Verbreitung steigen sowohl die Anforderungen an Skalierbarkeit und Update-Fähigkeit der Software-Stacks als auch der Druck, die Systemkosten für en solches ADAS-System pro Fahrzeug zu senken. KI-basierte Software-Stacks werden damit zum taktischen Hebel in kurzfristigen Produktentscheidungen – und zum strategischen Control Point im mittel- bis langfristigen Plattformwettbewerb.
Auf der Hardware-Seite erhöht KI die Fähigkeit, Informationen aus unterschiedlichen Sensormodalitäten – insbesondere Vision – zu extrahieren. So haben OEMs begonnen, ihre Sensor-Sets und die damit verbundenen BOM-Kosten pro Fahrzeug zu senken. LiDAR (lichtbasierte Sensoren zur optischen Abstands- und Geschwindigkeitsmessung) bleibt vor allem für Premium-OEMs attraktiv, die sich eine höhere BOM (Bill of Materials bzw. die Stückliste der verbauten Komponenten) leisten können, um Fahrverhalten zu verbessern, ODDs (Operational Design Domain bzw. den spezifischen Betriebsbereich des Systems) zu erweitern und Sicherheit weiter zu steigern; andere OEMs nutzen LiDAR primär zur Absicherung von Redundanzanforderungen in der Homologation.
Mit der Verlagerung der Rohdatenverarbeitung direkt in KI-Modelle auf Hochleistungsrechnern im Fahrzeug sinkt der Bedarf an Vorverarbeitung durch „intelligente“ Sensoren für autonomes Fahren – einfache Varianten und reine Sensor-Heads reichen zunehmend aus. Führende OEMs definieren deren funktionales Design bereits selbst und umgehen damit klassische Lieferantenstrukturen.
Für Supplier im Software-Bereich wird der Wettbewerb mit Tech-Playern immer härter – Budgetrestriktionen, Kultur und Geschwindigkeit setzen enge Grenzen. Gleichzeitig fehlt Tech-Playern weiterhin tiefes Automotive-Integrationswissen – hier können Automobilzulieferer mit Integrationsdienstleistung, Toolchains, Homologations-Expertise und globaler Rollout-Fähigkeit eine relevante Rolle einnehmen.
Im Hardware-Bereich müssen die TOP 100 Automobilzulieferer weltweit ihr „Right-to-Play“ in einer durch Vertikalisierung neu geordneten Wertschöpfungskette klar definieren. Die globale ADAS-Durchdringung über alle SAE-Level hinweg wird weiter steigen, sodass auch die Gesamtnachfrage nach zugehörigen Komponenten insgesamt wächst. Während bisher differenzierende Komponenten aus dem Suchfeld der OEMs verschwinden, entsteht für ausgewählte Zulieferer dadurch die Chance, sich als strategische Co-Development-Partner mit klarer technologischer Ankerkompetenz zu positionieren – aufgrund der Marktdynamik im Bereich Automotive ADAS wird sich das Zeitfenster dafür jedoch schnell schließen.
Sie müssen den Inhalt von reCAPTCHA laden, um das Formular abzuschicken. Bitte beachten Sie, dass dabei Daten mit Drittanbietern ausgetauscht werden.
Mehr InformationenSie sehen gerade einen Platzhalterinhalt von Turnstile. Um auf den eigentlichen Inhalt zuzugreifen, klicken Sie auf die Schaltfläche unten. Bitte beachten Sie, dass dabei Daten an Drittanbieter weitergegeben werden.
Mehr InformationenSie sehen gerade einen Platzhalterinhalt von Vimeo. Um auf den eigentlichen Inhalt zuzugreifen, klicken Sie auf die Schaltfläche unten. Bitte beachten Sie, dass dabei Daten an Drittanbieter weitergegeben werden.
Mehr InformationenSie sehen gerade einen Platzhalterinhalt von YouTube. Um auf den eigentlichen Inhalt zuzugreifen, klicken Sie auf die Schaltfläche unten. Bitte beachten Sie, dass dabei Daten an Drittanbieter weitergegeben werden.
Mehr InformationenSie müssen den Inhalt von reCAPTCHA laden, um das Formular abzuschicken. Bitte beachten Sie, dass dabei Daten mit Drittanbietern ausgetauscht werden.
Mehr InformationenSie müssen den Inhalt von hCaptcha laden, um das Formular abzuschicken. Bitte beachten Sie, dass dabei Daten mit Drittanbietern ausgetauscht werden.
Mehr InformationenSie müssen den Inhalt von reCAPTCHA laden, um das Formular abzuschicken. Bitte beachten Sie, dass dabei Daten mit Drittanbietern ausgetauscht werden.
Mehr InformationenSie müssen den Inhalt von Turnstile laden, um das Formular abzuschicken. Bitte beachten Sie, dass dabei Daten mit Drittanbietern ausgetauscht werden.
Mehr InformationenSie müssen den Inhalt von hCaptcha laden, um das Formular abzuschicken. Bitte beachten Sie, dass dabei Daten mit Drittanbietern ausgetauscht werden.
Mehr InformationenSie müssen den Inhalt von reCAPTCHA laden, um das Formular abzuschicken. Bitte beachten Sie, dass dabei Daten mit Drittanbietern ausgetauscht werden.
Mehr InformationenSie sehen gerade einen Platzhalterinhalt von Turnstile. Um auf den eigentlichen Inhalt zuzugreifen, klicken Sie auf die Schaltfläche unten. Bitte beachten Sie, dass dabei Daten an Drittanbieter weitergegeben werden.
Mehr Informationen