

Featured Insights
How AI and marketing automation are reorganizing the automotive industry
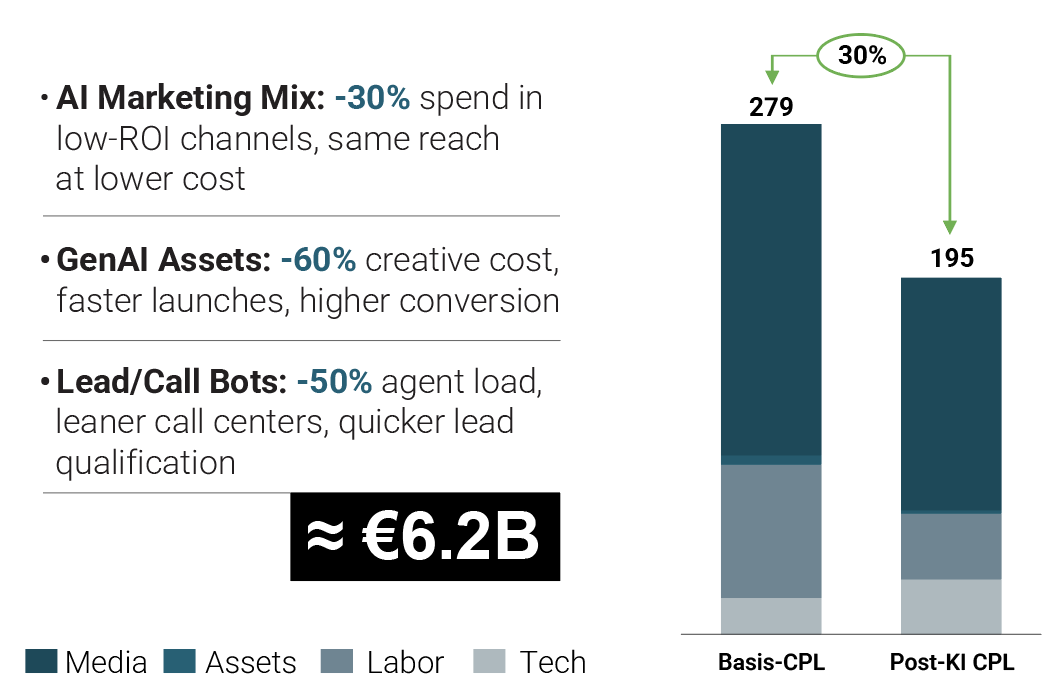
How AI and marketing automation are reorganizing the automotive industry Munich, January 2026 A utomotive Marketing Under Pressure — Competing in an Era of Shrinking