WANT TO DISCOVER MORE?
SEARCH
hat will define success for automotive suppliers in 2026?
The industry is undergoing a profound transformation – shaped by technological disruption, geopolitical shifts, margin pressure, and changing market dynamics. For leadership teams, this is no longer about navigating a cycle, but about managing a structural reset that touches every part of the business.
From CEOs to COOs, CIOs, CSOs, CFOs, CTOs, Heads of Aftermarket, and shareholders, each role faces a distinct set of challenges – yet all are united by the need to drive resilience, focus, and execution in an increasingly complex environment.
Dr. Jan Dannenberg, Dr. Alexander Timmer. Dr. Jürgen Simon, Dr. Hannes Weckmann
The automotive supplier industry is facing a phase of structural realignment. Electrification, software-driven vehicle architectures, and a changing role of OEMs are shifting value creation and the competitive logic of the industry. At the same time, pricing pressure, overcapacity, and geopolitical fragmentation are increasing the economic pressure on many business models. For CEOs, this means consistently aligning portfolio, organization, and structures toward future viability and resilience.
What CEO‘s need to act on now:
1. Radically prioritize the portfolio: Margin and volume pressure leave no room for historical loyalties. Capital must not remain tied up in structurally weak businesses. Future-proof fields must be consistently strengthened, while others must be restructured, sold, or discontinued.
2. Restructure competitiveness structurally: Cost differences between regions and increasing OEM price pressure intensify the pressure on European locations. One-off efficiency programs are no longer sufficient. What is required is a structural realignment through scaling, standardization, and consistent automation.
3. Define technological priorities clearly: Electrification, software, and system integration are changing the industrial logic of the industry. Investments must be focused and prioritized. Broad technology bets without clear differentiation weaken the strategic position.
4. Actively steer customer strategy: OEMs are integrating vertically and reducing supplier complexity. At the same time, new market participants, particularly from China, are gaining global importance. Suppliers must consciously prioritize which customers and platforms they want to grow with and where dependencies need to be reduced.
5. Align steering to scenarios: Volatile call-offs, uncertain BEV quotas, and geopolitical dynamics are devaluing traditional planning logics. Strategic decisions must be based on clearly defined market and technology scenarios. Flexibility arises from prepared courses of action, not from short-term reaction.
6. Calibrate regional setup deliberately: Subsidy programs, trade barriers, and political tensions are changing location logics. Value creation must be organized more strongly along customers, markets, and regulatory frameworks. The regional structure is a strategic decision, not an operational adjustment.
7. Use consolidation as an opportunity: Overcapacity and refinancing pressure are leading to structural consolidation in the market. Companies must clarify where they want to actively gain market share or divest non-strategic areas. Consolidation determines future market position.
8. Align organization to execution strength: Parallel cost reduction and transformation are overloading many structures. Clear responsibilities, shortened decision paths, and consistent anchoring of targets are decisive. Speed becomes a competitive factor.
9. Reduce cyclical dependency: The high volatility of the automotive market increases earnings risks. A one-sided customer and market structure amplifies these fluctuations. Where possible, core capabilities should be transferred to adjacent industries and the revenue base broadened.
10. Systematically increase enterprise value: Valuation today is based on resilience, differentiation, and return on capital. Size alone no longer provides protection. Capital discipline, clear investment priorities, and a credible strategic positioning are prerequisites for sustainable value creation.
Nicolas Franzwa, Christian Grimmelt, Fritz Metzger, Hendrik Honert
The operational agenda of automotive suppliers is being redefined by volatility, cost differences between regions, geopolitical fragmentation, and accelerated technological change. Global standardized systems are losing effectiveness, while delivery capability, flexibility, and productivity are becoming the central competitive factors. For COOs, this means consistently aligning production networks, manufacturing systems, and organization toward resilience, scalability, and execution strength.
What COO‘s need to act on now:
1. Align production networks regionally: Global standardized systems are reaching their limits. Value creation must be organized more strongly along customers, cost structures, and geopolitical risks. Regional footprints thus become a strategic prerequisite for delivery capability and competitiveness.
2. Manage volatile demand with flexible systems: Call-off fluctuations, model changes, and diverging drivetrain paths increase operational uncertainty. Manufacturing and logistics must be aligned to modular structures, quickly adjustable capacities, and robust processes in order to react flexibly to market fluctuations and optimize capital binding. Flexibility becomes the core of industrial performance capability.
3. Restructure cost and scaling logic structurally: Chinese price pressure and declining global economies of scale intensify the pressure on European locations. One-off programs are not sufficient. What is required are radically simplified product and process architectures, reduced complexity, a lower cost base, and early anchoring of automation capability and modular manufacturing.
4. Adapt capabilities, organization, and leadership to the new industrial logic: Demographics, skilled labor shortages, and new competency requirements are changing the industrial working world. Operations require systematic qualification programs, more digital capabilities, and clearer responsibilities on site. Leadership is shifting away from control toward capability building and speed.
5. Expand into growth regions in a targeted operational way: Structural growth is shifting to new markets. Production and delivery models, and thus investments, must therefore be selectively aligned to prioritized regions. Regional lead markets form the basis for scalable production and delivery networks, which can be complemented by local partnerships, licensing models, or contract manufacturing.
6. Anchor automation, AI, and virtual production architectures as the new performance standard: Increasing process speeds, capacity limits, and complexity require deeper integration of automation, AI, and virtual control. AI must move from monitoring to active decision support and lead operational core processes into closed control loops, while advanced robotics and humanoid systems expand automation into previously manual areas. Digital continuity, standardized information flows, and a clear AI roadmap create the foundation for scaling and efficiency.
Christian Kaiser, Himanshu Khandelwal, Malte Broxtermann
The IT agenda of automotive suppliers today goes far beyond classic system stability. New software and data architectures, rising cyber risks, and the pressure to quickly translate AI into measurable value are fundamentally changing the role of the CIO. What is needed is an IT function that simultaneously ensures stability, accelerates transformation, and unlocks new value levers.
What CIO‘s need to act on now:
1. Align IT architecture for speed and scalability: Historically grown system landscapes slow down many organizations. CIOs must simplify application landscapes, reduce interfaces, and create a modernized data and platform architecture. Only then can new solutions be implemented quickly and at scale.
2. Focus AI on concrete value levers: AI must not remain a technology topic without a results orientation. Priority is given to use cases with measurable impact in quality, planning, engineering, and administrative processes. The key is consistent scaling of a few relevant use cases rather than many pilot projects.
3. Build a robust data foundation and governance: Many initiatives fail not because of algorithms, but due to insufficient data quality and missing ownership. Data models, responsibilities, and access logics must be clearly defined. A robust data foundation is a prerequisite for automation and AI.
4. Structurally strengthen cybersecurity in IT and OT: Connected plants, software products, and edge devices significantly increase the attack surface. Security architectures must consider IT and OT in an integrated way and focus more on prevention, transparency, and responsiveness. Cybersecurity thus becomes a business-critical stability factor.
5. Standardize digital plant and production systems: Production-related IT is too heterogeneous in many companies. MES, shopfloor, and planning landscapes must be more harmonized to increase transparency, scalability, and automation. Standardization is the foundation for efficient digital operations.
6. Digitize business processes end-to-end: High manual efforts in back-office, SCM, and finance processes tie up capacity and increase error rates. IT must collaborate with business units to digitize end-to-end processes and consistently embed automation. This creates efficiency gains and better controllability.
7. Position the IT organization as a transformation driver: The role of IT is shifting from an internal service provider to an active enabler of transformation. This requires clearer prioritization, closer business alignment, and new capabilities in data, AI, and product management. The IT organization itself thus becomes a competitive factor.
Jonas Wagner, Dr. Xing Zhou, Thorsten Lips, Henning Ludes
The sales and growth agenda of automotive suppliers is fundamentally changing due to market share shifts, new competitors, and declining visibility in OEM programs. Classic sales logics are no longer sufficient to secure growth, profitability, and strategic relevance simultaneously. For CSOs, this means consistently realigning the portfolio, customer base, and commercial management.
What CSO‘s need to act on now:
1. Critically clean up the customer portfolio: Volume without profit contribution weakens the commercial position. Suppliers must define program-level exit thresholds and consistently review which customers, programs, and platforms generate sustainable profit and where renegotiation, withdrawal or a hard cut is required. The goal is a customer portfolio that better connects profitability and strategic relevance.
2. Deliberately broaden the customer base in Asia: Asia continues to gain importance and market share. Where strategically sensible partnership and co-development with Chinese OEMs should be established, with local presence, separate branding where needed, appropriate cost logic, and faster decision-making. At the same time, India, ASEAN, and selected Gulf states should be systematically monitored and selectively entered as markets with future growth potential, gradually reducing dependency on established Western OEMs. Additional opportunities arise from the expansion of Chinese OEM presence in Europe via local programs, partnerships, and co-development.
3. Select RFQs consistently and manage them professionally: In an environment of scarce resources and high margin pressure, sales must not respond to every RFQ with the same intensity. Clear go/no-go criteria based on strategic relevance, capacity, and minimum margin help reduce overhead and improve the profitability of the offer portfolio. Standardized offer logics, digitization of the entire project lifecycle, cross-functional bid teams, and closer integration with development and operations increase win rate and execution certainty.
4. Reset commercial management to be data-driven and AI-supported: Price, volume, contract, and pipeline information must be consolidated into integrated commercial management. The goal is to make pricing decisions more informed, detect margin deviations earlier, and deploy sales resources more effectively. To avoid diffuse “analytics programs,” CSOs should pay attention to the right sequence: Establishing a solid data foundation and future-proof commercial logic before deploying AI pricing and margin management.
5. Actively use contract design to secure margins: Contracts must be understood again as a commercial control lever. Indexation mechanisms for raw materials and energy, volume corridors, cost-sharing models, and appropriate payment terms should be systematically and risk-appropriately always backed by OEM‑specific negotiation playbooks rather than generic clause templates.
At the same time, existing contracts (also with AI support) should be systematically reviewed for renegotiation and claims potential. Contract management thus becomes an active lever for margin and cash protection rather than an administrative process.
6. Future-proof the sales organization: strengthen the frontend, automate the backend: On the frontend, key account management needs to cover the full OEM stakeholder map — procurement, engineering, platform management, and senior leadership — and be measured on account profitability and strategic position, not only on revenue. On the backend, standardizable activities such as RFQ intake, pricing calculations, reporting, and basic order handling should be systematically automated At the same time, new requirements arise in analytics, AI, and digital sales management. A future-proof sales organization works closer to the customer, data-driven, and significantly more efficiently.
7. Anchor strategic partnerships & ecosystem management as a distinct discipline: Technology and market access can often only be secured together with partners. Co-development and technology partnerships can strengthen differentiation and shorten development times, while JVs, sales partners, and selective acquisitions facilitate access to China, ASEAN, and India. Success requires a structured partnership portfolio with clear categories (growth, resilience, adjacency). Partnership management thus becomes an independent commercial competence, with clear processes and success metrics, rather than a collection of opportunistic deals.
Dr. Jan Dannenberg, Jens Haas, Dr. Xing Zhou
The finance agenda of automotive suppliers is shaped by declining visibility, expensive refinancing, and high profit pressure. Volatile orders, delayed ramp-ups, and structurally low margins increase pressure on liquidity, transparency, and capital discipline. For CFOs, this means aligning financial management, refinancing, and performance management consistently with resilience and actionability.
What CFO‘s need to act on now:
1. Actively secure liquidity: Volatile orders and fluctuating profit contributions increase pressure on short-term solvency. Liquidity must not only be monitored but actively managed. Early warning systems, robust forecasts, and clear escalation mechanisms are mandatory.
2. Set up refinancing early and strategically: Rising interest rates and more cautious lenders change the financing logic of many suppliers. Refinancing must be prepared early and spread across multiple instruments. Late action results in loss of negotiation power and strategic options.
3. Consistently reduce working capital: Inventories, receivables, and cash flows tie up too much capital in many companies. CFOs must re-anchor working capital as a central management metric. Sustainable improvement comes from tighter management of inventories, receivables, and payment terms.
4. Actively negotiate and secure payment terms: Long OEM payment terms strain liquidity and increase financing needs. Payment terms must therefore be treated more as a strategic lever. The goal is more robust cash conversion, not just better price negotiation.
5. Targeted expansion of factoring and alternative instruments: Classic bank financing is no longer sufficient in many cases. Factoring, ABS-like structures, and other instruments can secure liquidity and reduce dependencies. An active instrument mix is essential, rather than a purely bank-based approach.
6. Create transparency on product and project profitability: Many suppliers still manage too much by total margin rather than the actual profit contributions of individual products and programs. CFOs need reliable transparency on customer, project, and product profitability. Only then can losses be detected early and countermeasures initiated.
7. Centralize and professionalize cash management: In an environment of higher capital costs, cash management becomes a value driver. Cash flows, liquidity reserves, and financing sources must be centrally managed and closely linked with operations. Financial flexibility thus becomes a leadership task.
8. Strictly prioritize capital allocation: Not every investment deserves capital in this environment. Resources must be focused on competitive businesses, mandatory investments, and clearly value-adding programs. Capital discipline thus becomes the core of financial strategy.
9. Use consolidation from a position of strength: Structural pressure leads to market cleanup and opens opportunities for selective acquisitions. CFOs must define when M&A creates value and when balance sheet protection takes priority. Acting from financial strength, not pressure, is decisive.
10. Align finance function to transformation: The role of the CFO shifts from reporting and control to active transformation management. Finance must provide scenarios, make value contributions transparent, and accelerate decisions. The finance function thus becomes a strategic lever itself.
Christian Kaiser, Dennis Röhr, Shreyas Sirsi
The technology agenda of automotive suppliers is being redefined by major technological transformations such as electrification, software, new material requirements, and shorter innovation cycles. Broad technology programs without clear prioritization tie up capital without creating differentiation. For CTOs, this means consistently aligning development resources, innovation portfolios, and partnerships to relevant future fields.
What CTO‘s need to act on now:
1. Clearly prioritize technology portfolio: Not every future technology deserves the same resource allocation. A clear direction is needed on which fields allow differentiation and where only connectivity is required. Focus becomes a prerequisite for impact and capital discipline.
2. Align R&D more closely with customer benefit and industrializability: Technological excellence alone is no longer sufficient. Innovation must be measured against real customer needs, time-to-market, and manufacturability. Successful development combines differentiation with scalability and cost efficiency.
3. Strategically recalibrate R&D sites: Political tensions, local regulations, and regionalized customer requirements increasingly pressure global development models. It is essential to clearly define where global platform development remains sensible and where local-for-local or regional development approaches become necessary. Development sites must be aligned more closely with customer proximity, technology protection, and talent access. The R&D footprint thus becomes a strategic decision, not merely an efficiency question.
4. Set up technology platforms to allow regional differentiation: A globally uniform product is no longer sufficient in many areas. Different requirements in China, North America, and Europe regarding regulation, software, data, and customer expectations increasingly necessitate regional variants and approval logics. Platforms must be designed to allow regional adaptation without fully losing scale effects. The key lies in modular architectures with clearly defined global and regional elements.
5. Systematically drive material and cost innovation: Price and margin pressure force new materials, intelligent material substitutions, and simplified product architectures. Innovation must be more strongly linked with design-to-cost and resource efficiency. Competition increasingly arises from better technical cost solutions.
6. Significantly increase development speed: Shorter model cycles and new competitors increase pressure on R&D processes. Development organizations must make faster decisions, work more iteratively, and use digital tools more consistently. Speed becomes a technological competitive factor.
7. Actively leverage partnerships and ecosystems: Many future fields can no longer be developed alone. It is essential to collaborate strategically with software providers, semiconductor companies, research partners, and start-ups. Partnerships thus become a fixed part of technological competitiveness.
8. Strengthen platform and modular kit logics: Variant diversity increases development effort and weakens scale effects. Technological platforms and modular kits are necessary to improve reuse, speed, and cost efficiency. Standardization becomes a prerequisite for effective innovation.
9. Align technology roadmaps more closely with market and customer logic: R&D must not be managed in isolation from customer, regional, and platform strategies. Technology roadmaps must be aligned with real market opportunities and customer decisions. Relevance arises from the close connection between technology and business strategy.
10. Trim the innovation organization for impact: Many development organizations are historically grown and too broadly structured. Responsibilities must be sharpened, priorities clearly set, and resources consistently redistributed. Innovation strength arises not from breadth, but from focus and execution power.
Paul Kummer, Thorsten Lips, Dr. Hannes Weckmann, Florian Tauschek
The aftermarket is becoming strategically more important for automotive suppliers because it offers stability, strong margins, and lower cyclicality than the classic OE business. At the same time, electrification, software-coded parts, new competitors from China, and the growing power of platforms and distributors are changing the market rules. For Heads of Aftermarket, this means consistently developing the business as an independent growth and profit lever.
What Head of Aftermarket needs to act on now:
1. Establish aftermarket as a strategic stability anchor: While OE volumes stagnate and margins remain under pressure, the independent aftermarket is developing into a stable earnings foundation. A comparatively small revenue share generates a disproportionately high profit contribution and acts counter-cyclically. The aftermarket must evolve from an appendage to a pillar of corporate strategy.
2. Consistently occupy Segment II and III: Beyond the first vehicle years, OEM workshops rapidly lose market share. In age segments four to fourteen years, the structural growth and margin potential of the IAM lies. Successful providers build independent value strategies, secondary brands, reman programs, and workshop-near services.
3. Actively monetize electrification: BEVs change maintenance structures and reduce classic wear-related revenues. At the same time, new value fields arise in battery testing, high-voltage service, thermal management, and ADAS calibration. Those who develop a holistic lifecycle strategy for electric vehicles early secure long-term relevance.
4. Secure control over the future of coded parts: Cybersecurity requirements and OEM software locking are changing access logic to the aftermarket. Parts are increasingly software-dependent; activation and authentication become business-critical. Providers who establish secure coding and update solutions turn regulatory pressure into a scalable business model.
5. Strategically respond to China’s European expansion: Chinese OEMs and suppliers are entering the European aftermarket with aggressive pricing and new sales models. This increases competitive pressure but also opens cooperation and sourcing opportunities. Success comes from clearly defining where to compete, where to act in partnership, and where to use production capacity.
6. Independently shape workshop relationships: Digital platforms and distributors gain control over assortment, visibility, and pricing. Suppliers risk losing brand strength and customer access. Direct digital interfaces, technical support, and data-based services strengthen their position in the workshop ecosystem.
7. Focus the portfolio and reduce complexity: The growing SKU variety increases logistics costs and weakens service quality. Sustainable profitability arises from targeted portfolio rationalization and investment in margin-strong, unavoidable aftermarket categories. White-label production additionally offers utilization and profit potential.
8. Use circular economy as a competitive advantage
Regulations, insurers, and fleet operators promote repair instead of replacement models. Remanufacturing and refurbishment are evolving from compliance topics to independent value drivers. Those who establish functioning return, refurbishment, and service processes position themselves as long-term sustainability partners.
Dr. Xing Zhou, Dr. Jürgen Simon
The shareholder agenda of automotive suppliers is being newly defined by structural market shifts, declining visibility, and a fundamentally changed financing context. Classic growth assumptions, valuation logics, and leadership profiles often no longer apply. For shareholders, this means consistently aligning portfolio, capital base, and leadership model with transformation, resilience, and value protection.
What Shareholders need to act on now:
1. Strictly prioritize investments in Germany: Not every automotive investment in Germany is attractive under the new framework conditions. The decisive factor is where technological differentiation, customer proximity, and industrial competitiveness come together. Capital must flow selectively into future-proof fields, not historically grown structures.
2. Set up financing more broadly and robustly: Many banks are reducing their automotive exposure or becoming significantly more selective. Shareholders must therefore secure alternative financing sources early, such as private debt, specialized financiers, or hybrid structures. Financing security becomes a strategic prerequisite for actionability.
3. Realistically recalibrate valuation: Historical multiples and reference transactions are often no longer reliable benchmarks. Company values must be derived more from resilience, cash generation, technology position, and transformation capability. Realistic valuation is the basis for good decisions, not a sign of weakness.
4. Actively scout suitable partners and investors: In a fragmented market, strategic partners, financial investors, and new capital sources are gaining importance. Shareholders must clarify who can genuinely contribute capital, market access, technology, or operational strength. The right partner selection increasingly determines the quality of strategic options.
5. Staff management appropriately for restructuring and transformation: Many leadership teams were built for stable markets, not for intensive restructuring. Shareholders must ensure management brings experience in restructuring, performance management, and deep transformation. Leadership competence thus becomes a central value lever.
6. Clearly define China strategy: China is simultaneously a growth market, competitor, and geopolitical risk. Shareholders must decide where offensive presence makes sense, where partnerships create value, and where withdrawal is the better option. Ambivalence is not a viable strategy.
7. Broaden the portfolio beyond automotive: High cyclicality and structural uncertainty in the automotive market increase the risk of concentrated portfolios. Shareholders must examine which capabilities are transferable to adjacent industries and where diversification creates value. The question is not only how much automotive remains, but which automotive is still attractive.
8. Actively leverage consolidation: Market cleanup creates opportunities for strong owners with a clear agenda. Shareholders must define where to actively acquire, merge, or divest. Consolidation thus becomes an opportunity for value creation rather than a risk.
9. Consistently guide portfolio decisions by capital return: Emotionally attached investments or historically important businesses must no longer receive special treatment. Investment and holding decisions must consistently be guided by return, risk, and strategic relevance. Capital discipline becomes the core task of the ownership side.
10. Understand value creation as an active transformation program: In the current environment, value is not created by waiting, but by active shaping. Shareholders must closely manage portfolio, management, financing, and strategy. Shareholder value thus becomes the result of consistent transformation leadership.
Download the full agenda now!
hat will consumers expect from their next car – and how much of that expectation is shaped by where they live?
Download the full survey now!

igh‑voltage battery (HVB) remanufacturing is rapidly becoming a major value driver across the electrified mobility and stationary energy landscape.
Yet many OEMs, industrial equipment manufacturers, and key suppliers still lack a comprehensive approach to managing the remanufacturing lifecycle. This emerging field offers a powerful opportunity: gaining strategic control over battery flows, safeguarding residual values, enhancing lifecycle profitability, and advancing circularity and ESG objectives. Companies that move early will set industry benchmarks, secure access to used modules, and strengthen long‑term customer confidence.
Developing a successful HVB remanufacturing strategy requires navigating complex decisions and forming the right partnerships:
Early adopters stand to benefit significantly over the long term by:
HVB remanufacturing is emerging as a critical value stream in the evolving EV and ESS landscape. The window to establish a leading position is narrowing – now is the moment to act.
Download the full study now! For further discussion or questions, our authors are happy to connect.
utomotive Marketing Under Pressure — Competing in an Era of Shrinking Budgets and Rising Expectations
The European automotive industry is under extraordinary pressure. Electrification costs, tariff challenges, and escalating competition are forcing OEMs to deliver more output with fewer resources. Marketing, once a creative playground, has become a strategic battleground where efficiency, speed, and scalability determine competitive advantage. Yet most OEMs are confronted with long-established structures and lack of speed. Everyday marketing operations are fragmented across regions and channels, consuming excessive time and budget while limiting change and innovation. Redundant processes, manual processes, overlapping agency networks, and inconsistent brand and sales experiences are common symptoms. To hold up against internal and external pressures while pushing competitiveness, OEMs must fundamentally rethink how they plan, produce, and distribute marketing across all touchpoints.
Download the full insight now!
lectric mobility is expanding globally, but along divergent paths. In Europe and the United States, BEV adoption follows a top-down model, concentrated in higher-priced premium segments (D-E) under the automotive A-F segmentation, which classifies vehicles by size, price, and comfort, with F representing the highest luxury tier.
China, in contrast, is electrifying from the bottom up: entry-level segments (A-B) account for 38.1% of BEV sales, supported by electrification rates of 71.1% in the A-segment and 70.3% in the B-segment. This focus on affordability and scale enables broad adoption, faster learning curves, and rapid volume growth.
Figure 1 – BEV sales share by region within respective sales segment across the United States, Europe and China, 2025.
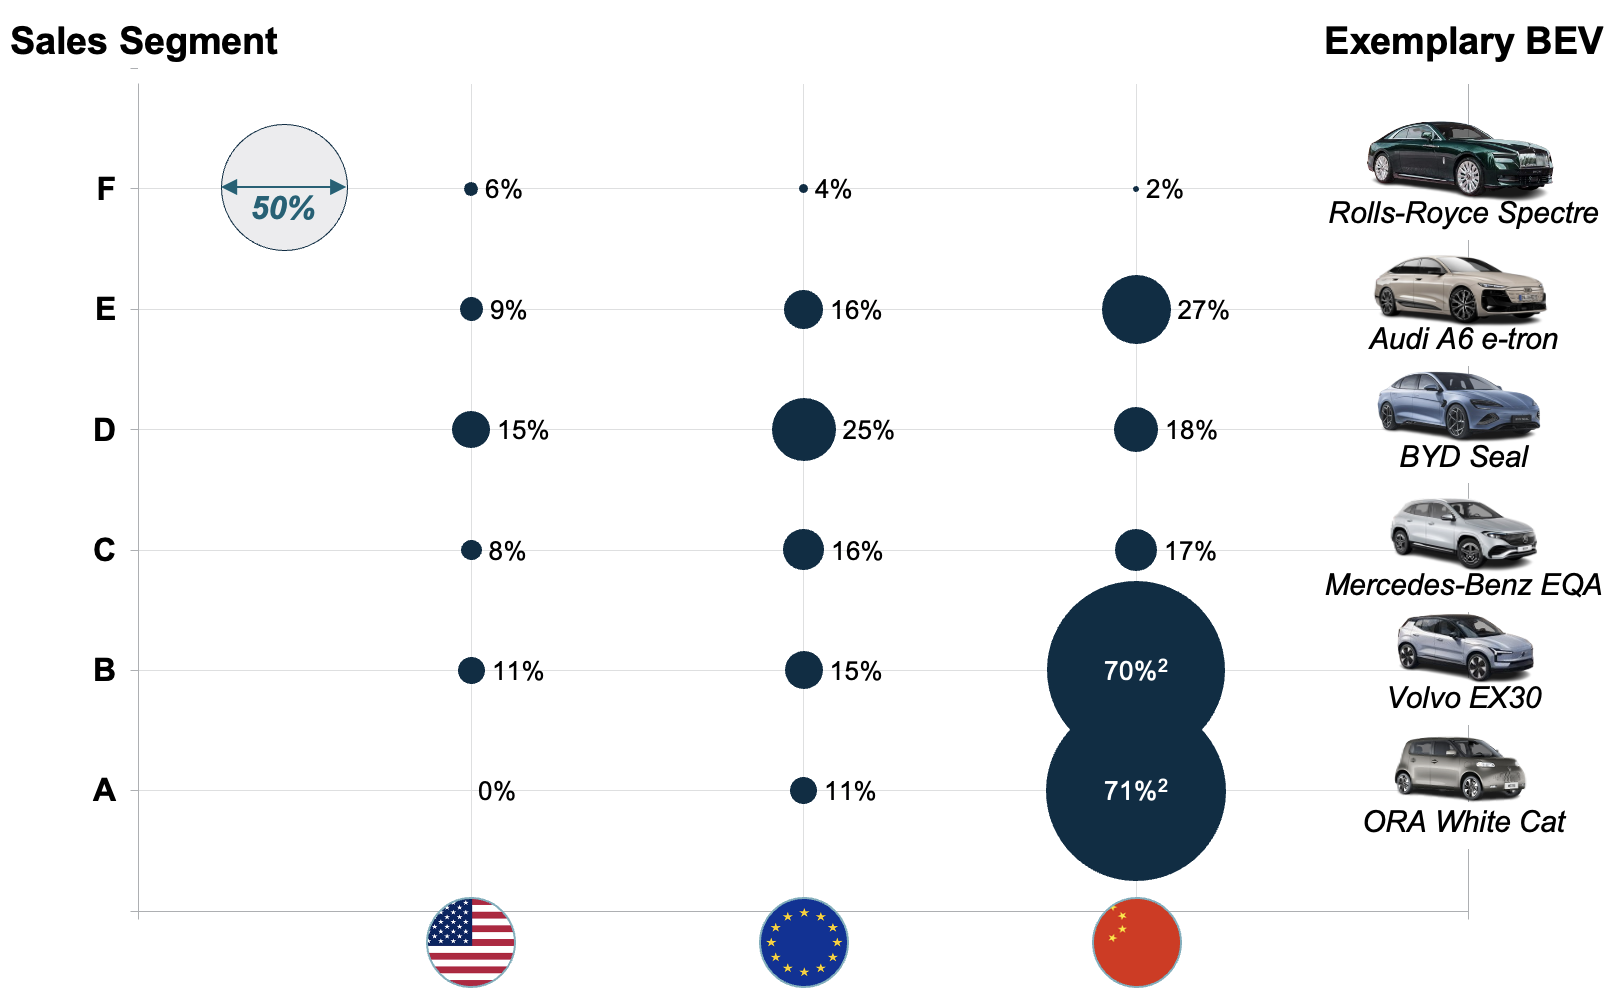
¹ Only sales share depicted from 0-100%, no absolute sales figures shown.
² Entry-level segments in China are almost entirely Chinese-origin (Seg. A: 100%, Seg. B: 95%).
Source: Berylls by AlixPartners analysis based on S&P global LV sales
This difference is no longer a marginal observation. It is shaping market dynamics, cost structures, and long-term competitiveness in the global automotive industry. At its core lies a simple question: are electric vehicles becoming a mass-market solution, or do they remain a premium product for a narrow customer base?
In the United States and Europe, BEV demand is concentrated in mid-size and premium segments, mainly larger sedans and SUVs. Both regions show the highest EV shares in the D segment, with 15% and 25%, respectively. This is economically rational for manufacturers, as higher-priced vehicles better absorb battery and technology costs and protect margins. This leads to a distortion of the market towards more premium vehicles among BEVs: The share of the D-segment among BEVs is 8%p (Europe) and 14%p (US) higher compared to a total market view, also including combustion engine vehicles.
The downside however is weak penetration in smaller, high-volume segments. The U.S. illustrates this clearly: electrification lags not due to technology limits, but because affordable entry-level BEVs are scarce and consumer preferences strongly favor pickups and large SUVs. Due to this, the A- and B-segments are traditionally small in the US (combined market share of 5% in 2025). However, lagging electrification is showing also in the large C-segment (38% of total market), highlighting problems with entry-level BEVs on this market.
Europe reaches a similar outcome for different reasons. While small segments matter more than in the U.S. (combined market share of 34%), BEV demand is heavily influenced by company car taxation. In markets such as Germany, company cars represent over 53% of new BEV registrations, reinforcing demand for larger, better-equipped vehicles and skewing the BEV mix toward premium segments.
China follows a fundamentally different electrification path. Small and compact electric vehicles dominate everyday mobility, supported by dense cities, short driving distances, and a well-developed charging network that makes entry-level BEVs practical and economical. Electrification has therefore advanced fastest in smaller vehicle segments, where BEV penetration is already very high and electric powertrains dominate in some categories. This shows especially in the A&B segment. With a combined market share of 14% across all propulsion types, these segments are not the most attractive from an OEM perspective, at least on first look. However, these segments make up over 38% of the BEV market, driven by a high BEV sales share of 70%+ in both segments (see figure 1).
This scale-driven approach has accelerated learning and cost reduction, turning BEVs into a mainstream mobility solution rather than a premium niche. Structural cost advantages – an integrated domestic supply chain, strong battery manufacturing, and widespread use of cost-efficient LFP chemistry – enable Chinese OEMs to price BEVs aggressively while sustaining scale.
The divergence between China and Western markets is structural, shaped by market design, incentives, and policy. High upfront investments have pushed Western OEMs toward premium vehicles to protect margins, slowing mass-market electrification. Policy frameworks reinforce this: Europe’s 2035 target offers long-term direction but weak near-term pressure, while U.S. incentives are constrained by price caps and sourcing rules.
China, in contrast, has consistently driven mass-market electrification through stable policy, infrastructure investment, and industrial coordination – making small vehicle segments the core of large-scale adoption.
Looking ahead, global BEV adoption will become more balanced, but regional differences will persist.
Figure 2 – BEV sales share¹ by region within respective sales segment, 2025 vs. 2030
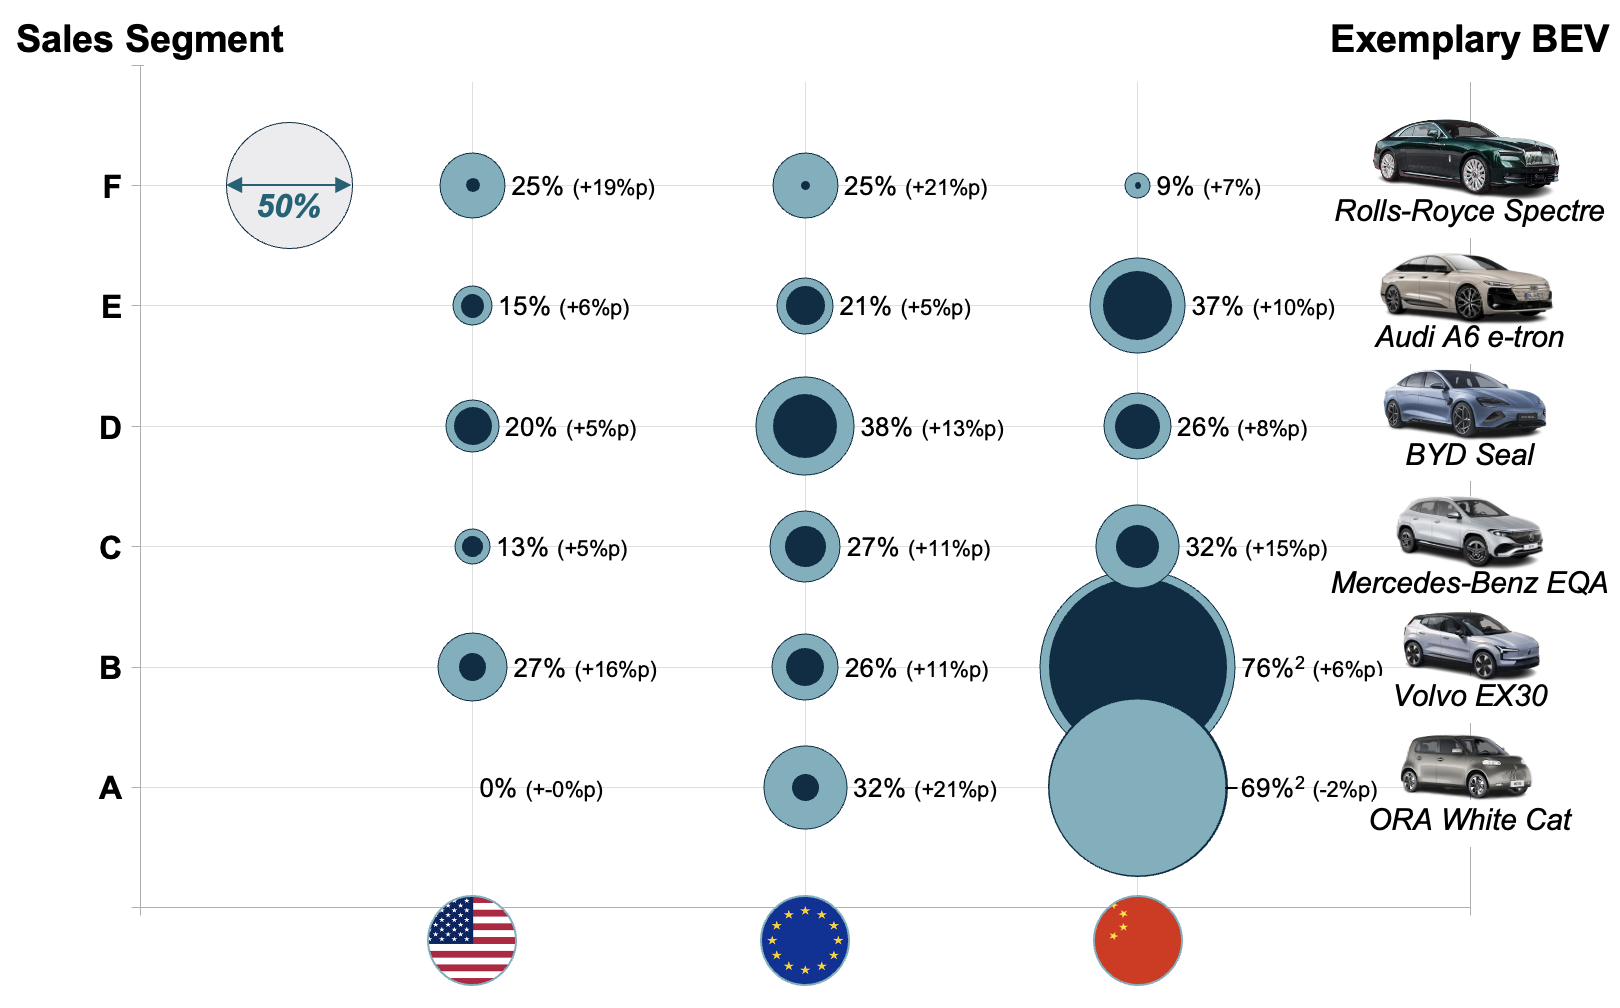
¹ Only sales share depicted from 0-100%, no absolute sales figures shown.
² Entry-level segments in China are almost entirely Chinese-origin (Seg. A: 100%, Seg. B: 94%).
Source: Berylls by AlixPartners analysis based on S&P global LV sales
The United States is likely to remain the slowest major BEV market, with adoption polarized between premium models and a limited set of lower-end offerings due to affordability, infrastructure, and segment constraints. In the largest market segments (C/D/E), the BEV sales share growth is at 6&p or lower until 2030.
Europe, on the other hand, is on a broader electrification trajectory. BEV adoption is expanding across all segments by 2030 and driving a gradual shift toward near-complete fleet electrification within the next decade. In every segment except for the E-segment, the BEV share will grow by double-digit percentage points until 2030.
Lastly, China is entering a new phase: Having almost entirely electrified lower segments by 2025, Chinese fleet electrification is moving upmarket, intensifying competition in mid-size and premium segments domestically and internationally. Even though the electrification growth in the C-/D- and E-segments are comparable to Europe over the next five years, the continent will still be ahead based on higher BEV shares from the get-go (except for the D-segment).
The global shift to electric mobility is becoming structurally asymmetric: Europe is slowly advancing toward full-fleet electrification, China is moving up the automotive value chain, and the United States risks falling further behind.
For Western OEMs, the question is no longer whether to electrify, but how. Long-term competitiveness depends on closing the affordability gap in lower segments while defending premium positions against increasingly capable Chinese competitors. At the same time, China remains a critical strategic market – both as the world’s largest BEV ecosystem and as the primary source of competitive pressure as Chinese OEMs expand into Western markets.
The window remains open but is narrowing. Without a credible path to mass-market electrification, the democratization of electric mobility in the West will remain incomplete, with lasting competitive consequences.
n our annual analysis, we engaged with senior executives from 49 European automotive suppliers across a broad range of segments (including powertrain, E/E, interior, exterior, body, and software) and company sizes, among them multiple TOP 100 suppliers.
Most European suppliers continue to depend heavily on internal combustion engine (ICE) business, with little reduction expected before 2030. Expectations for revenue growth from e-mobility have weakened, while margin expectations remain mixed. Platform delays, underutilized BEV production capacities, and heightened competition (especially from China) reinforce a sense of strategic stagnation.
Despite these challenges, suppliers continue to diagnose themselves as strategically well prepared. This discrepancy between perceived readiness and market realities highlights a growing strategic dilemma at the heart of the transformation. This report presents the results of the 2025 survey, interprets the implications for suppliers, and outlines strategic recommendations for the years ahead.
Download the full insight now!
ES has clearly moved beyond consumer gadgets. It is now a technology and strategy forum where AI, robotics, and autonomy are reshaping how companies design products, run operations, and compete.
The overarching message this year was straightforward: Intelligence is becoming embedded everywhere, autonomy is moving into real deployments, and the line between digital and physical systems is disappearing. The winners will be those that can translate rapid technology progress into scalable, economic outcomes.
AI at CES shifted from experimentation to integration. It is no longer a set of features—it is becoming the core operating layer across vehicles, appliances, factories, and healthcare systems. The conversation moved from “agentic AI” toward physical AI—AI that not only reasons, but also acts in the real world.
What this signals
What leadership teams need to address
Where AlixPartners can help
Robotics crossed an important threshold at CES. Humanoid, service, and industrial robots are increasingly positioned as workforce solutions, not experiments—particularly in logistics, healthcare, hospitality, and manufacturing.
What this signals
What leadership teams need to address
Where AlixPartners can help
Autonomous driving messaging became notably more grounded, from bold L4/L5 timelines to scalable ADAS, software-defined vehicles, and incremental autonomy that can deliver near-term value.
What this signals
What leadership teams need to address
Where AlixPartners can help
CES made one point unmistakable: Winning companies won’t just be the best technologists—they’ll be the ones that translate intelligence and autonomy into scalable business models. Competitive advantage will go to companies that:
CES was not about the future arriving—it was about navigating the messy middle between breakthrough and scale. That is where AlixPartners play a critical role: bridging vision and execution, pressure-testing economics, and helping leadership teams move decisively from experimentation to impact.
ow are automotive marketing and sales evolving? And how to navigate growing electrification, digitalization and shifting customer expectations?
Main topics of this episode:
This Podcastepisode was recorded and published in December 2025 by Insights On Air, a Podcast by Berylls by Alix Partners
ulieferer sind erstmalig profitabler als OEMs, obwohl gleichzeitig beide Gruppen rückläufige Umsatzzahlen zu verzeichnen haben. Was lässt sich daraus für 2025/26 ableiten? Die Ergebnisse unserer TOP 25
Diese Ausgabe gibt es ebenfalls im Videoformat auf unserem YouTube Kanal:

Mit dem Laden des Videos akzeptieren Sie die Datenschutzerklärung von YouTube.
Mehr erfahren
Auf unserem YouTube Kanal findet ihr weitere Videoinhalte zum Thema:
This Podcastepisode was recorded and published in December 2025 by Insights On Air, a Podcast by Berylls by Alix Partners
NO TIME TO READ THIS WEBSITE?